School Finance 101: Chronicles of (the Conceptually Incoherent & Empirically Invalid World of) VergarNYa
As with the Vergara case in California, a central claim of the New York City Parents Union is that the presence of statutory tenure protections in New York State leads to a persistent and systematic deprivation of a sound basic education which falls disproportionately on the state’s low income and minority children.
Let’s review again the basic structure of this argument. The argument challenges state statutes that impose restrictions on district contractual agreements pertaining to procedures for evaluation and dismissal of teachers once they achieve “tenure” or continuing contract status.
The argument goes – within districts, minority and low income are disproportionately assigned the “least effective” teachers.
Within districts, minority and low income children are disproportionately affected by assignment of the least qualified teachers, including novice teachers and those not classified as “highly qualified.”
And this occurs because of statutory definitions of and job protections pertaining to “tenure.”
Now, to the extent that substantive disparities of the types mentioned above exist, the next trick is to show some connection to the laws in question.
These laws are presumed to affect all districts which operate under them similarly.
If these laws are unchanged over time, it is presumed that districts have little room to affect positive change in the distribution of teacher attributes when operating under these laws.
If a similar or greater share of variation in teacher attributes actually exists across districts (across separate teacher contracts) as opposed to within, then it is likely that some other factors are playing into the disparate assignment of teachers, including the sorting of teachers as they apply for jobs on the labor market, considering variations in working conditions and compensation.
Unless of course, we are arguing this case in the offbeat world of VergarNYa.
Let’s take a look at the actual data on NYC and NY state (NYC Labor market) teachers to see just how badly the actual data might undermine plaintiffs arguments before their case even gets off the ground.
For the following analyses, I’ve mined three sources of data which I have available at my fingertips because of previous projects:
- NYC Value Added estimates publicly posted in 2012.
- New York State Personnel Master File (teacher credentials and compensation)
- New York State School Report Cards (school demographics)
Do Low Income and Minority Children within NYC have the Least Effective Teachers using the City’s Own VAM Estimates?
I’ve explained previously the problems with using “effect” ratings themselves in determining equitable distributions, since we can’t always tell whether the distribution of teacher “effect” are inequitable, or biased. That is, do we appear to have more “bad” teachers in high poverty schools or are teachers getting bad ratings in part because they work in high poverty settings?
I’ve also explained previously, that while the New York State (NYSED) growth percentile scores tend to be significantly biased, by poverty and other demographic characteristics, New York City’s more refined Value Added Model produces significantly less bias. You might say – ah… that’s good… and in some ways it is. But it certainly doesn’t help the VergarNYa arguments, does it?
For example, Figure 1 below shows the demographic characteristics of NYC schools of the Upper Half of teachers by Value Added Percentile and the Bottom Third of teachers – among those in the upper half or bottom third for three consecutive years:
Figure 1.
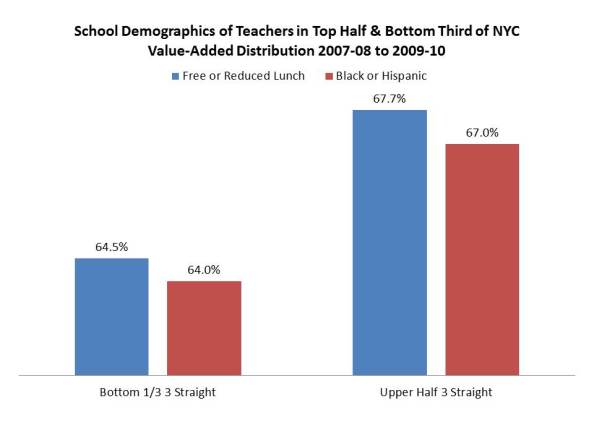
As it turns out, the percent black or Hispanic, and the percent free or reduced priced lunch is actually higher, on average, in schools of the teachers in the upper half.
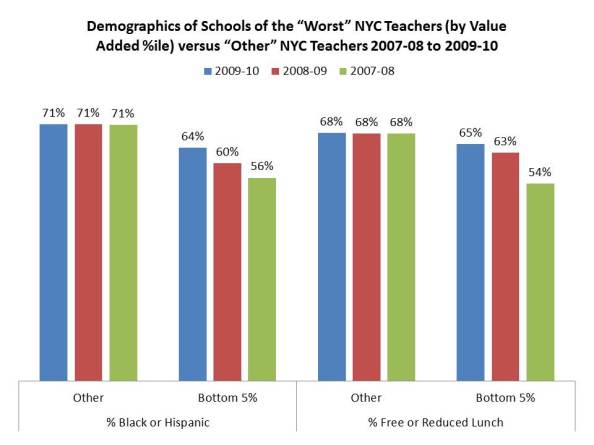
Ah… but you say, what about the really really really bad bottom 5% of teachers? What are the demographics of their schools? Well, again, comparing the bottom 5% to all others, the bottom 5% are in schools with a) lower shares of low income children and b) lower shares of disadvantaged minorities.
Figure 2.
Are the Odds Greater that Low Income or Minority Children within NYC have Less Qualified, or Novice Teachers?
Well, then, since our indicators of teacher “effect” aren’t sharply disparately distributed, unless we used the state’s biased measures, what about more traditional attributes of teachers – like concentrations of novice teachers, or state policy designations, like “highly qualified?”
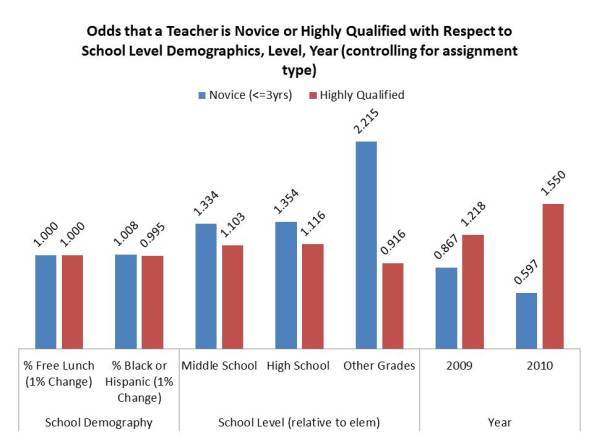
The next figure is based on logistic regression models evaluating the relative odds that a teacher in a school with X% versus X+1% low income or disadvantaged minority students is novice or not, or highly qualified or not. The models focus on New York City schools again. Figure 3 shows us that:
a) There is little if any shift in the likelihood that teacher is novice when % free or reduced priced lunch is higher, or when % black or Hispanic is higher.
b) There is a slight uptick (small but statistically significant, in part because we have such a large data set) in the likelihood that a teacher is novice as % black and Hispanic population increases, coupled with a slight decrease in the likelihood that a teacher is highly qualified.
- The uptick amounts to a <1% increase in likelihood that a teacher is novice for each 1% increase in % black and Hispanic population;
- The decrease amounts to about half of one percent in the likelihood that a teacher is highly qualified for each 1% increase in % black and Hispanic population.
Figure 3.
So, we do have some disparity here. That said, it’s still a heavy lift to suggest that a) this disparity rises to a level of substantial constitutional deprivation and even heavier lift to suggest that b) state teacher tenure laws have anything to do with the presence of this disparity (the apparent inability of the district to reshuffle teachers to negate this relationship between novice teacher concentration and student minority concentration).
The next figure evaluates total teaching experience using a regression model to parse the relationship between school demographics and average total years teaching. And this figure shows that for each additional 1% low income population, teacher experience… well… doesn’t really change. For each 1% additional disadvantaged minority population, teacher experience declines by 5% of one year.
Figure 4.
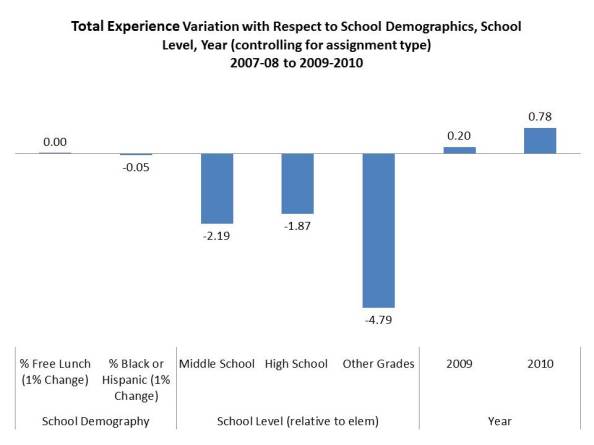
Again, we have some disparity with respect to minority concentration… but again, it’s one heck of a stretch to assume causation between state teacher tenure laws and differences of 5% of one year in average experience of teachers associated with each 1% change in percent minority student concentration.
Is this really a within district/within contract problem?
As I’ve pointed out in my previous two posts, the presumption that a major cause of teacher quality disparity affecting low income and minority children is state statutory protections of due process in dismissal cases, relies on substantial disparity in teacher attributes across schools within districts, as opposed to across districts. The idea, as expressed by the various local administrators in California who took the stand at trial, is that their hands are tied. They have no other choice because of the shackles of tenure and seniority protections, to keep bad teachers in low income and minority schools, and of course, keep good teachers in their less low income, less minority schools. It’s not their fault. It’s the law [a baffling admission indeed…].
But it’s quite possible that in fact, the major cause of disparity in teacher attributes disparately affecting low income and minority children lies in the ways teacher sort on the labor market – across districts – thus across contracts – and not within districts by leveraging state law to their defense and advantage.
How then, do student population characteristics compare for novice teachers and highly qualified teachers across versus within New York State districts? Figure 5 compares the demographics of schools of Novice teachers within NYC and within the NYC metro area, across districts.
Figure 5.
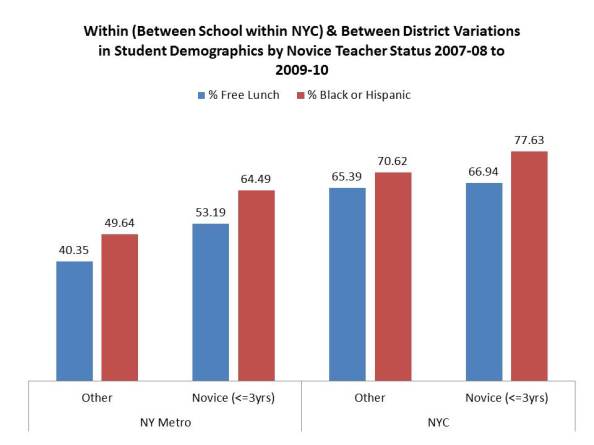
Figure 5 shows us that the disparities in populations are much greater across districts than within NYC.
- The % black or Hispanic population is about 15% higher in the districts of novice teachers than those who are not novice.
- The % low income is nearly 10% higher in the districts of novice teachers than those who are not novice.
- By contrast, within NYC, the percent black or Hispanic is about 7% (half the between district disparity) higher in schools of novice versus non-novice teachers, and the percent low income is between 1 and 2% greater in schools of novice teachers.
Do districts really have no ability to leverage change?
Finally, as I explained in my previous post, there already exists a substantial body of literature which severely undermines the assertion that local public districts in New York simply have no way to resolve teaching inequality across student populations. Most specifically, this one piece by Boyd and colleagues validates that New York City in particular made significant strides in the early 2000s at improving what had been far more substantive gaps in teacher attributes.
The gap between the qualifications of New York City teachers in high-poverty schools and low-poverty schools has narrowed substantially since 2000. For example, in 2000, teachers in the highest-poverty decile of schools had math SAT scores that on average were 43 points lower than their counterparts in the lowest-poverty decile of schools. By 2005 this gap had narrowed to 23 points. The same general pattern held for other teacher qualifications such as the failure rate on the Liberal Arts and Sciences (LAST) teacher certification exam, the percentage of teachers who attended a “least competitive” undergraduate college, and verbal SAT scores. Most of the gap-narrowing resulted from changes in the characteristics of newly hired teachers, rather than from differences in quit and transfer rates between high and low-poverty schools.
Boyd, D., Lankford, H., Loeb, S., Rockoff, J., & Wyckoff, J. (2008). The narrowing gap in New York City teacher qualifications and its implications for student achievement in high‐poverty schools. Journal of Policy Analysis and Management,27(4), 793-818. http://cepa.stanford.edu/sites/default/files/Narrowing.pdf
And so it goes…. In the land of VergarNYa… a world where logical fallacy rules the day and where empirical evidence simply doesn’t matter…
This blog post has been shared by permission from the author.
Readers wishing to comment on the content are encouraged to do so via the link to the original post.
Find the original post here:
The views expressed by the blogger are not necessarily those of NEPC.
