Cloaking Inequity: Whats Good for Goose, is Good for Gander: Feds Propose Changes to Civil Rights Data
 Unbelievably, I have travelled more than 20,000 miles over the past five weeks— Brazil, Princeton, New York City, Las Vegas and Oregon. Imagine a scenario where I showed up at the airport and the airline employee gave me the following choices:
You can fly on an airplane today with a pilot with 30 hours of alternative pilot certification training.

You can fly on an airplane today with a pilot who has five weeks of training in a special pilots corp.

You can fly on an airplane today with a pilot who has been certified to fly the plane and has a year of teaching experience learning curriculum planning, pedagogy, and classroom management. I mean flying the plane…

Which would you choose?

This is essentially the conversation we are having about teacher quality in the public discourse today. Does that mean that all alt certs with low levels of training will crash the classroom? Of course not, but what is the probability that they will? Furthermore, the “proof is in the pudding,”

By that I ask: What do the wealthy demand for their children?
How about this scenario. So when you arrive the airport, you see this sign:

Ok Ok, I get it, we already have a sign like this at the security line. But stay with me anyways.
So for the poor the airline only gives majority of flyers (students) only two choices: Pilots trained with five weeks of training or 30 hours of training. Which would you choose? If my choices are bad and worse, well, I would choose the five weeks of training to be honest with you. This is what you see when principals glow about TFA teachers. They have had a false choice, either you take the five weeks or the 30 hour alt certs. It is rare that you get a high quality UTeach teacher as an option in most “hard to staff” urban and rural public schools.
So, the rich are directed to the right in the airport, guess which choice they have? Well, of course, a highly-qualified teacher.
My mother described her opposition to inequality to me when I was a child as “What is good for the goose is good for the gander.”

So the only input (relative to outputs such as test scores and AYP) in the No Child Left Behind Act was the high-quality teacher definition. The problem with this definition is that it was left up to states to define what “high-quality” meant. In Texas, this meant as long as you were working towards a certification you were considered high-qualified. In practice, this means you can teach almost a decade without being certified if you changed school levels every few years. So what did NCLB do to teacher quality in the U.S. See the graph below from a presentation a student made in my course last week.
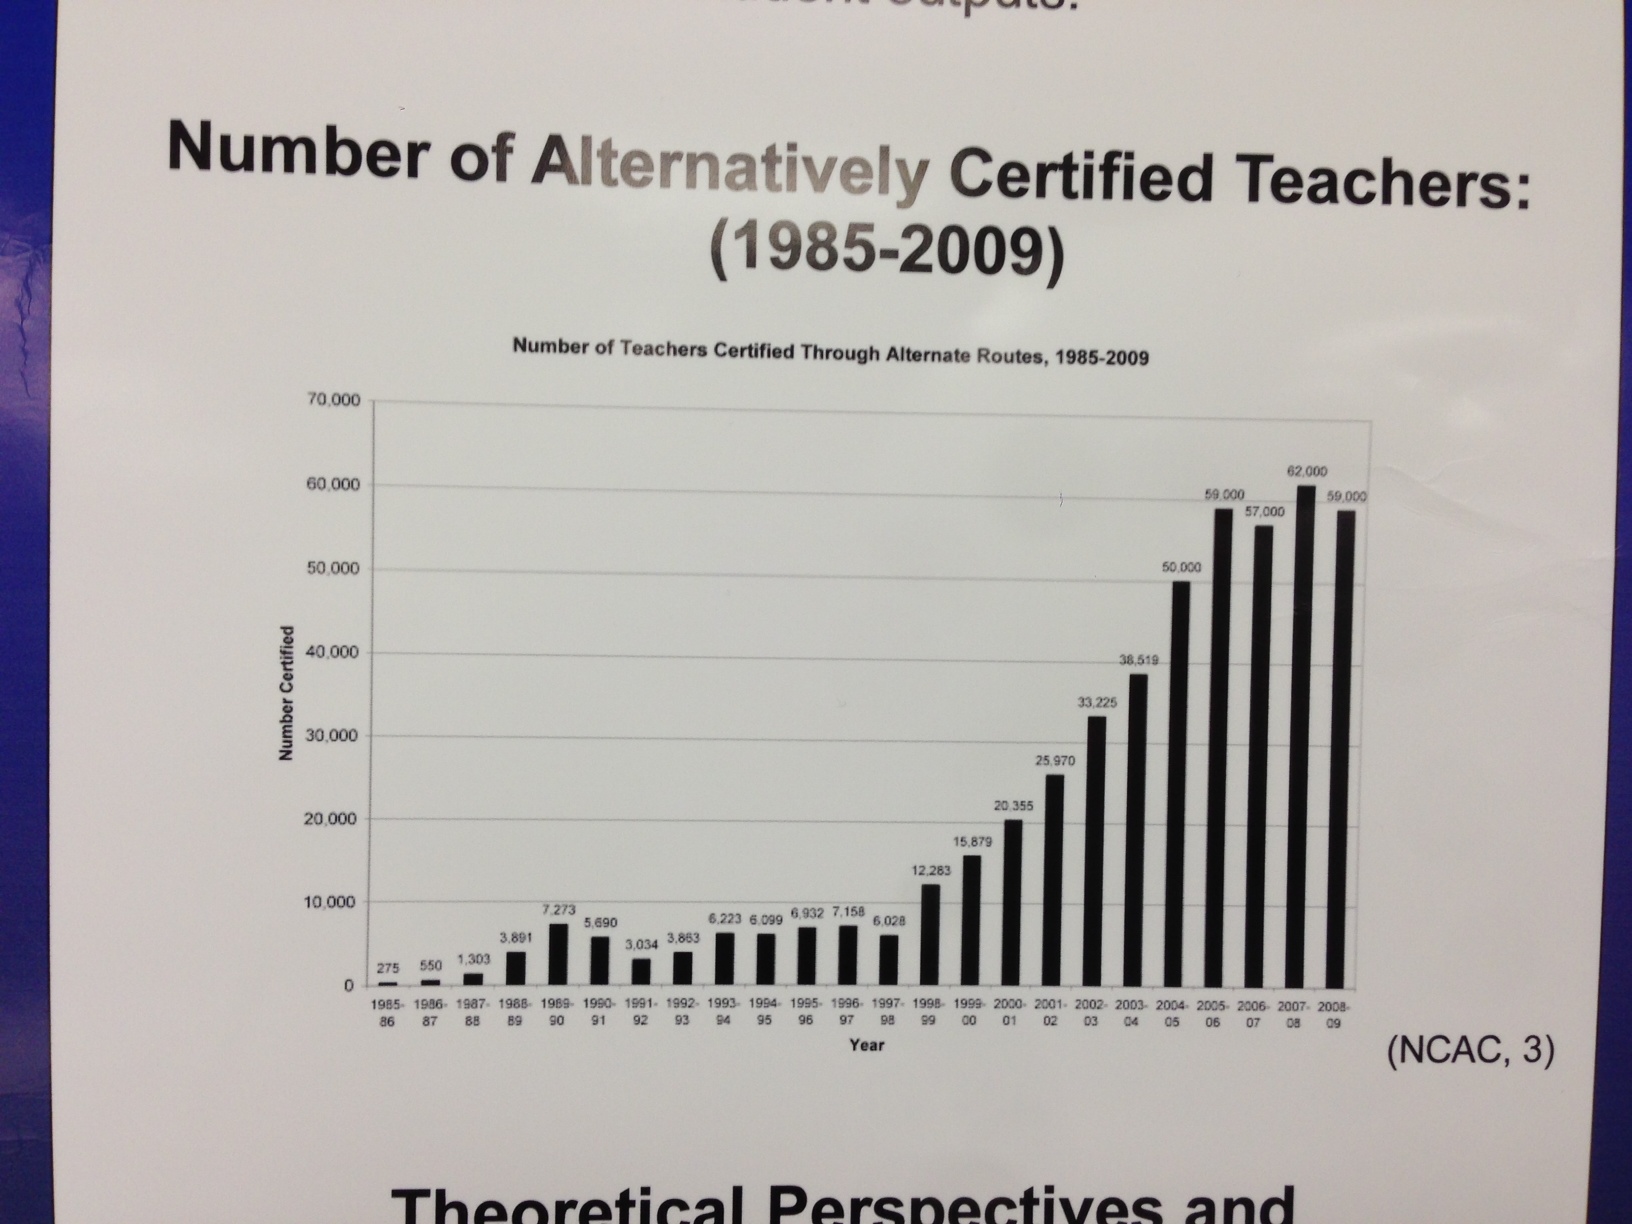
Although the exact numbers are hard to see in the photograph I took of his poster, you can make out an explosion of teachers (pilots) with very limited experience heading into our schools over the past decade across the US— more dramatic than the decades that preceded. Is this a Civil Rights issue?
An excerpt from an upcoming chapter entitled A Quandary for School Leaders: Equity, High-stakes Testing and Accountability
Despite the persistent assault on teacher certification and training, the most successful countries in the world are focused on placing highly qualified and expertly trained teachers into the classroom (Darling-Hammond, 2010). In the U.S., the current policy reform movement is pressing to find alternative routes to the classroom for teachers who lack training and certification. Vasquez Heilig, Cole, and Springel (2011) argued that teacher training and experience can never be replaced with short-term, Band-Aid solutions such as alternative certification programs and Teach For America. Teachers trained at selective and highly ranked teacher education programs are effective teachers (Clotfelter, Ladd, & Vigdor, 2007). Teachers who stay in the profession for more than five years have better pedagogical skills, and are able to develop and maintain effective classroom management and discipline than teachers with less time in the classroom (Darling-Hammond, Holtzman, Gatlin, & Vasquez Heilig, 2005). We know who good teachers are, and we know something about how to train them to be effective (Darling-Hammond, 2010). Unfortunately, we are not using that knowledge in our current school reform efforts. Instead, a strong push of the current reform era is a political push to remove standards, and the loosening of requirements and definitions is only likely to exacerbate the inconsistencies within the profession (Vasquez Heilig, Cole, & Springel, 2011).
That brings us to the federal governments request to no longer keep track of this huge influx of teachers with a modicum of training to “pilot” our classrooms. The Department of Education is seeking public comments on the Civil Rights Data Collection process for 2013-2016. The feds have decided that it is no longer necessary to keep track of the FTE of teachers meeting all state licensing/certification requirements. The feds have also decided these data points are also no longer important for Civil Rights:
- Number of students awaiting special education evaluation (LEA)
- Whether students are ability grouped for English/Math
- Harassment and bullying policies (LEA)
- Number of students enrolled in AP foreign language(disaggregated by race, sex, disability, LEP)
- Number of students who took AP exams for all AP courses enrolled in (disaggregated by race, sex, disability, LEP)
- Number of students who passed AP exams for all AP courses enrolled in (disaggregated by race, sex, disability, LEP
- Total personnel salaries
What do you think about this explosion of inexperienced teachers with limited training disproportionately assigned to our nation’s poor in urban and rural areas? Are you annoyed? Outraged? You can comment on the proposed removal of a survey items. Here is the link for submitting comments on the CRDC proposed changes.
Please Facebook Like, Tweet, etc below and/or reblog to share this discussion with others.
Want to know about Cloaking Inequity’s freshly pressed conversations about educational policy? Click the “Follow blog by email” button in the upper left hand corner of this page.
Twitter: @ProfessorJVH
P.S. Here is a full list of proposed new and continuing CRDC questions put together by Joe Bishop from OTL. Items that OCR is proposing to add are underlined .
School & District Characteristics
- Number of public schools (LEA)
- Grades offered (PS-12) (PS refers to preschool and excludes birth-2)
- Whether ungraded school has mainly elementary school age students; middle school age students; high school age students; elementary and middle school age students; middle and high school age students; elementary middle, and high school age students
- Number of students (PS through grade 12) served by LEA in LEA and non-LEA facilities (LEA)
- Total number of students (preschool through grade 12) enrolled in school (disaggregated by race, sex, disability-IDEA, disability-504 only, LEP)
- Number of students with disabilities (disaggregated by race, sex, LEP)
- Number of LEP students and number of students enrolled in LEP programs (disaggregated by race, sex, disability-IDEA)
- Whether the school is operating a magnet program for all students or some students within the school (and if so, whether entire school population participates in the magnet program)
- Whether the school is an alternative school (and if so, for academic or discipline or both)
- Whether the school is focused primarily on serving students with disabilities
- Whether the school is a charter school
- For justice facility only:
- Type of facility (pre- or post-adjudication/conviction or both)
- Number of days that makeup the justice facility’s regular school year
- Total number of hours per week that educational program is offered during regular school year
- Number of students who participated in educational program for less than 15 calendar days; 15-30 calendar days; 31-90 calendar days; 91-180 calendar days; more than 180 calendar days.
- Number of single-sex academic classes (with males only; with females only) in the following courses/subject areas:
- Algebra I, Geometry, and/or Algebra II
- Other mathematics
- Science
- English/reading/language arts
- Other academic subjects
- Whether LEA has civil rights coordinators for discrimination against students on basis of sex, race, and disability (and contact information) (LEA)
- Whether LEA is covered by desegregation order or plan (LEA)
Discipline
- Students (K-12) who received one or more in-school suspension:
- Number of K-12 students without disabilities who received one or more in-school suspension (disaggregated by race, sex, LEP)
- Number of K-12 students with disabilities who received one or more in-school suspension (disaggregated by race, sex, disability-504 only, LEP)
- Students who received one out-of-school suspension:
- Number of preschool students who received one out-of-school suspension (disaggregated by race, sex, disability-IDEA, LEP)
- Number of K-12 students without disabilities who received one out-of-school suspension (disaggregated by race, sex, LEP)
- Number of K-12 students with disabilities who received one out-of-school suspension (disaggregated by race, sex, disability-504 only, LEP)
- Students who received more than one out-of-school suspension:
- Number of preschool students who received more than one out-of-school suspension (disaggregated by race, sex, disability-IDEA, LEP)
- Number of K-12 students without disabilities who received more than one out-of-school suspension (disaggregated by race, sex, LEP)
- Number of K-12 students with disabilities who received more than one out-of-school suspension (disaggregated by race, sex, disability-504 only, LEP)
- Number of preschool students who were expelled (disaggregated by race, sex, disability-IDEA, LEP)
- Students (K-12) who were expelled (with educational services; without educational services; because of zero-tolerance policies):
- Number of K-12 students without disabilities who were expelled (with educational services; without educational services; because of zero-tolerance policies) (disaggregated by race, sex, LEP)
- Number of K-12 students with disabilities who were expelled (with educational services; without educational services; because of zero-tolerance policies) (disaggregated by race, sex, disability-504 only, LEP)
- Students (K-12) who were removed for disciplinary reasons (to alternative school; to regular school):
- Number of K-12 students without disabilities who were removed for disciplinary reasons (to alternative school; to regular school) (disaggregated by race, sex, LEP)
- Number of K-12 students with disabilities who were removed for disciplinary reasons (to alternative school; to regular school) (disaggregated by race, sex, disability-504 only, LEP)
- Students (K-12) who were referred to law enforcement agency or official:
- Number of K-12 students without disabilities who were referred to law enforcement agency or official (disaggregated by race, sex, LEP)
- Number of K-12 students with disabilities who were referred to law enforcement agency or official (disaggregated by race, sex, disability-504 only, LEP)
- Students (K-12) who were arrested for school-related activity:
- Number of K-12 students without disabilities who were arrested for school-related activity (disaggregated by race, sex, LEP)
- Number of K-12 students with disabilities who were arrested for school-related activity (disaggregated by race, sex, disability-504 only, LEP)
- Students who received corporal punishment:
- Number of preschool students (ages 3-5) who received corporal punishment (disaggregated by race, sex, disability-IDEA, LEP)
- Number of K-12 students without disabilities who received corporal punishment (disaggregated by race, sex, LEP)
- Number of K-12 students with disabilities who received corporal punishment (disaggregated by race, sex, disability-504 only, LEP)
- Number of instances of corporal punishment that students (preschool through grade 12) received (disaggregated by students without disabilities, students with disabilities)
- Number of school days missed by students who received out-of-school suspensions (disaggregated by students without disabilities, students with disabilities (IDEA), students with disabilities (504 only)
- Documented incidents that occurred at the school that would trigger discipline, including referrals to law enforcement and arrests:
- Number of incidents of robbery with a weapon
- Number of incidents of robbery with a firearm or explosive device
- Number of incidents of robbery without a weapon
- Number of incidents of physical attack or fight with a weapon
- Number of incidents of physical attack or fight with a firearm or explosive device
- Number of incidents of physical attack or fight without a weapon
- Number of incidents of threats of physical attack with a weapon
- Number of incidents of threats of physical attack with a firearm or explosive device\
- Number of incidents of threats of physical attack without a weapon
- Number of incidents of rape or attempted rape
- Number of incidents of sexual battery (other than rape)
- Number of incidents of possession of a firearm or explosive device
- Whether any of the school’s students, faculty, or staff died as a result of a homicide committed at the school
- Whether there has been at least one incident at the school that involved a shooting (regardless of whether anyone was hurt)
Harassment and bullying
- Number of reported allegations of harassment or bullying of K-12 students on the basis of: sex; race, color, or national origin; disability; sexual orientation; religion
- Number of K-12 students reported as harassed or bullied on the basis of: sex; race, color, or national origin; disability (disaggregated by race, sex, disability-IDEA, disability-504 only, LEP)
- Number of K-12 students disciplined for engaging in harassment or bullying on the basis of: sex; race, color, or national origin; disability (disaggregated by race, sex, disability-IDEA, disability-504 only, LEP)
Restraint and Seclusion
- Students (K-12) subjected to mechanical restraint:
- Number of non-IDEA K-12 students subjected to mechanical restraint (disaggregated by race, sex, disability-504 only, LEP)
- Number of K-12 students with disabilities (IDEA) subjected to mechanical restraint (disaggregated by race, sex, LEP)
- Students (K-12) subjected to physical restraint:
- Number of non-IDEA K-12 students subjected to physical restraint (disaggregated by race, sex, disability-504 only, LEP)
- Number of K-12 students with disabilities (IDEA) subjected to physical restraint (disaggregated by race, sex, LEP)
- Students (K-12) subjected to seclusion:
- Number of non-IDEA K-12 students subjected to seclusion (disaggregated by race, sex, disability- 504 only, LEP)
- Number of K-12 students with disabilities (IDEA) subjected to seclusion (disaggregated by race, sex, LEP)
- Number of instances of mechanical restraint, physical restraint, seclusion (disaggregated by students without disabilities, students with disabilities-IDEA, students with disabilities-504 only)
Single Sex Interscholastic Athletics
- Number of single-sex interscholastic athletics high school sports (with males only; with females only)
- Number of single-sex interscholastic athletics high school teams (with males only; with females only)
- Number of student participants on single-sex interscholastic athletics high school sports teams (with males only; with females only)
Early Childhood Education
- Whether LEA’s early childhood program(s) serve non-IDEA children birth-2 (LEA)
- Preschool length offered (full-day, part-day) and cost (free, partial charge, full charge) (LEA)
- Number of students served by LEA in preschool programs in LEA and non-LEA facilities (disaggregated by age – 3, 4, 5) (LEA)
- Whether preschool is provided to: all students, students with disabilities (IDEA), students in Title I schools, students from low income families (LEA)
- Whether preschool serves non-IDEA students age 3; age 4; age 5 (LEA)
- Number of students ages 3-5 enrolled in preschool (disaggregated by race, sex, disability-IDEA, LEP)
- Whether the school’s preschool program serves non-IDEA students (disaggregated by age– 3, 4, 5)
- Whether LEA is required to provide full-day or part-day kindergarten by state statute or regulation (LEA)
- Kindergarten length offered (full-day, part-day) and cost (free, partial charge, full charge) (LEA)
Pathways to College and Career
- Number of students enrolled in gifted & talented programs (disaggregated by race, sex, disability-IDEA, LEP)
- Number of students enrolled in distance education courses (disaggregated by race, sex, disability-IDEA, LEP)(LEA)
- Number of students enrolled in at least one dual enrollment/dual credit program (disaggregated by race, sex, disability-IDEA, LEP)
- Whether the school has any students who participate in at least one credit recovery program that allows them to earn missed credit to graduate from high school
- Number of students absent 15 or more school days (disaggregated by race, sex, disability-IDEA, disability-504 only, LEP)
- Number of students enrolled in the International Baccalaureate (IB) Diploma Programme (disaggregated by race, sex, disability-IDEA, LEP)
- Number of different AP courses provided
- Whether students are allowed to self-select for participation in AP courses
- Number of students enrolled in at least one AP course (disaggregated by race, sex, disability-IDEA, LEP)
- Number of students enrolled in at least one AP course in specific subject area (disaggregated by race, sex, disability, LEP)
- AP math of any kind
- AP science of any kind
- Other AP subjects of any kind (including foreign language)
- Number of students who took one or more AP exams for one or more (which may include all) AP courses enrolled in (disaggregated by race, sex, disability-IDEA, LEP)
- Number of students who were enrolled in one or more AP courses but who did not take any AP exams (disaggregated by race, sex, disability-IDEA, LEP)
- Number of students who passed one or more AP exams for one or more (which may include all) AP courses enrolled in (disaggregated by race, sex, disability-IDEA, LEP)
- Number of students who did not pass any AP exams for the one or more AP courses enrolled in (disaggregated by race, sex, disability-IDEA, LEP)
- Number of classes in math and science (Algebra I, Geometry, Algebra II, Advanced Math, Calculus, Biology, Chemistry, Physics)
- Number of students enrolled in Algebra I in grade 7 (total count)
- Number of students enrolled in Algebra I in grades: 8; 9&10; 11&12 (disaggregated by race, sex, disability-IDEA, LEP)
- Number of students who passed Algebra I in grade 7 (total count)
- Number of students who passed Algebra I in grades: 8; 9&10; 11&12 (disaggregated by race, sex, disability-IDEA, LEP)
- Number of students enrolled in Geometry in grade 8 (total count)
- Number of students enrolled in Geometry in grades 9-12 (disaggregated by race, sex, disability-IDEA, LEP)
- Number of students (grades 9-12) enrolled in other math and science courses, by subject (Algebra II, Advanced Math, Calculus, Biology, Chemistry, Physics) (disaggregated by race, sex, disability-IDEA, LEP)
- Number of students who took SAT, ACT, or both, anytime during school year (disaggregated by race, sex, disability-IDEA, LEP)
- GED preparation program (LEA):
- Number of students ages 16-19 who participated in LEA-operated GED prep program (disaggregated by race, sex, disability-IDEA, LEP)
- Number of students ages 16-19 who participated in LEA-operated GED prep program, succeeded on GED test, and received high school equivalency credential (disaggregated by race, sex, disability-IDEA, LEP)
- Whether LEA has policy that allows retention of third grade students who are not proficient in reading (LEA)
- Number of students retained in specified grade, by grade (K-12) (disaggregated by race, sex, disability-IDEA; disability-504 only, LEP)
School finance (funded with state and local funds)
- K-12 personnel FTEs and salaries at the school level (funded with state and/or local funds)
- Number of FTE teachers and amount of their salaries
- Number of FTE instructional staff (teachers & aides) and amount of their salaries
- Number of FTE support services staff for pupils and amount of their salaries
- Number of FTE support services staff for instructional staff and amount of their salaries
- Number of FTE school administration staff and amount of their salaries
- Number of FTE non-instructional staff and amount of their salaries
- Total amount of non-personnel expenditures at the school level
Teachers (funded with federal, state, and/or local funds)
- Number of FTE teachers (preschool through grade 12)
- Number of FTE first-year teachers (preschool through grade 12)
- Number of FTE second-year teachers (preschool through grade 12)
- Number of FTE teachers absent more than 10 school days (excluding professional development) (preschool through grade 12)
- Number of FTE school counselors (preschool through grade 12)
- Number of FTE psychologists (preschool through grade 12)
- Number of FTE social workers (preschool through grade 12)
- Number of FTE security guards (preschool through grade 12)
- Number of FTE school resource officers (preschool through grade 12)
- Number of FTE sworn law enforcement officers (preschool through grade 12)
This blog post has been shared by permission from the author.
Readers wishing to comment on the content are encouraged to do so via the link to the original post.
Find the original post here:
The views expressed by the blogger are not necessarily those of NEPC.