School Finance 101: Filling our Nation’s Funding Gaps
Mark Weber, Matt Di Carlo and I have a new report, with data and visualizations available over at schoolfinancedata.org. For that project, we take advantage of two major data sources to estimate a “cost model” for public school districts in the United States – specifically with the goal of estimating the per pupil costs (spending, controlling for differences in efficiency) to achieve a common outcome goal. We set that common outcome goal at the very modest level of existing national average outcomes on state assessments of reading and math achievement, grades 3 to 8. Yes, these are limited outcomes. Yes, this is a low bar. But, our main point here is to evaluate the disparities that exist across states and districts in the funding available, relative to the predicted costs, of achieving this modest target. Education cost analyses of this type have helped us better understand two things:
- It costs more to achieve higher outcomes than lower ones; and
- It costs more to achieve any given level of outcomes in some settings, with some children, than others!
State school finance systems state accountability systems for schools have historically been disjoint. On the one hand, we use state assessment data and other outcome measures to declare schools or districts good or bad – exceptional or failing. But rarely do we design and implement school funding systems that are actually built upon estimates of a) the costs of achieving the desired outcome levels, on average, or b) how those costs vary from one setting and child to the next. That is, we don’t design state school finance systems to deliver the funding that would provide each school or district with equal opportunity to hit the targets we set in state accountability policies. Thus, we necessarily create an unfair playing field. This is true in every state, though some more than others. We’ve rarely even considered how these disparities play out across states. That is, whether children in Mississippi should have equal opportunity to achieve outcomes similar to children in Massachusetts, and what that might cost.
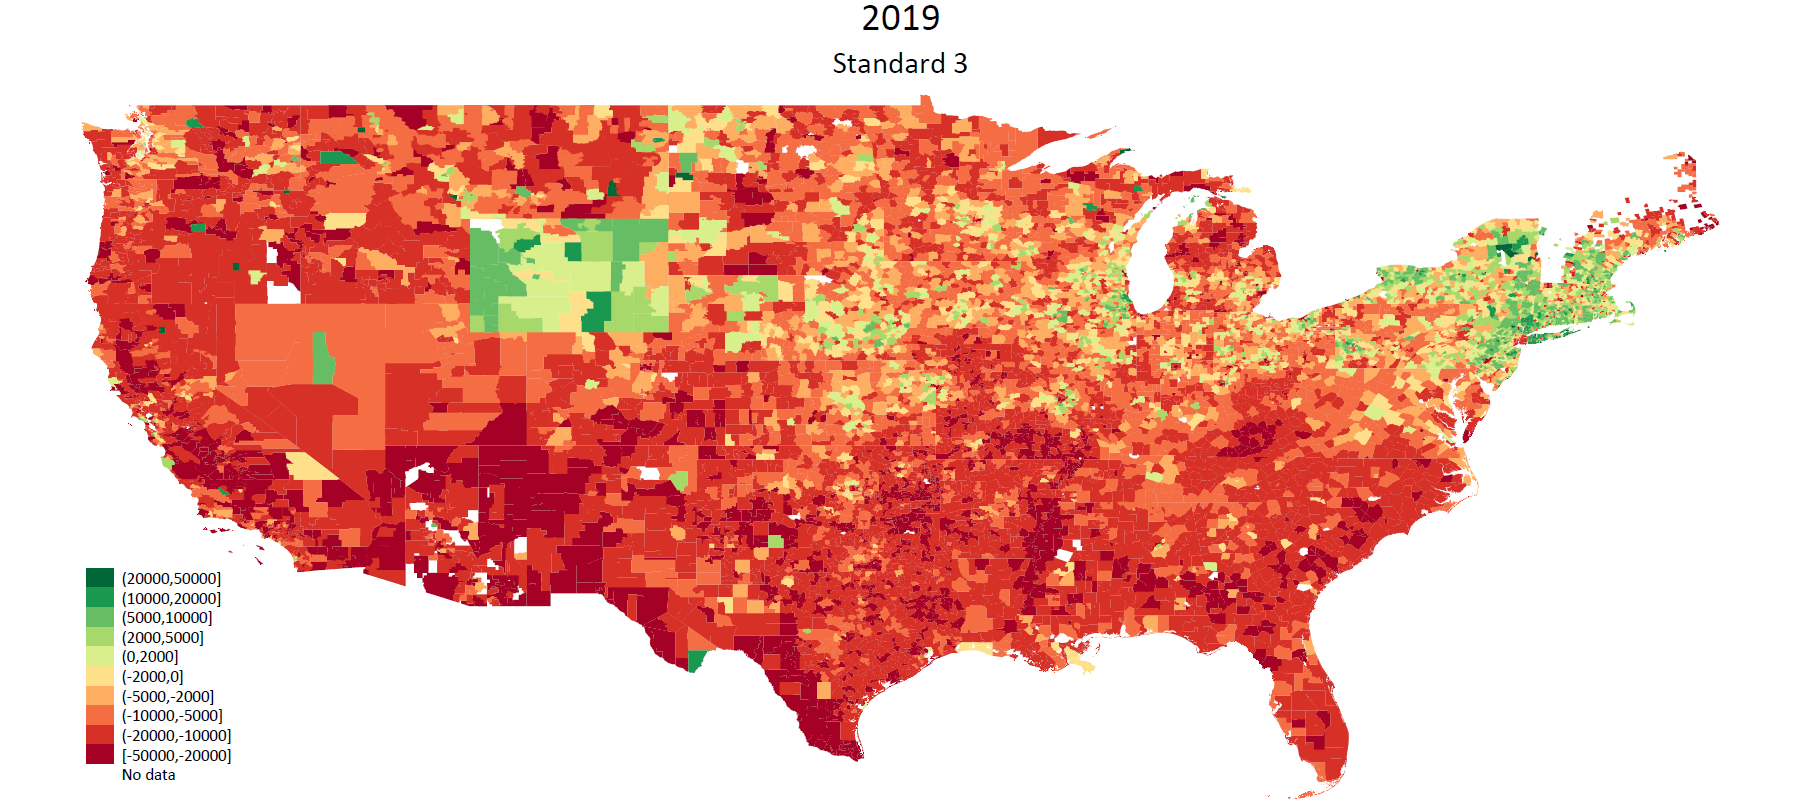
Here’s what those funding gaps look like with respect to costs to achieve national average outcomes, for 2019, based on a model fit to data on spending, outcomes and various other school and district characteristics from 2009 to 2018.

Here’s what the outcome gaps look like in 2018:

In other words, the outcome gaps line up largely with the funding gaps. Where states, schools and districts spend enough to achieve average outcomes, they generally do achieve those outcomes. It’s not a perfect relationship, but it is a clear one. Further, deviations from this relationship occur for a few different reasons – some of which we suspect are a result of data which simply aren’t fully comparable – fully equated from one state to the next.
Still, these data give us a pretty good picture where in the country and within specific states we need substantially more investment in schooling to achieve even modest outcomes. To put these gaps into context, in 2021, the total sum of money needed to fill the red in the first map is about $130 Billion! While that seems huge, and is, it’s also about the same amount of money included in the new federal stimulus package for schools. But, a) that stimulus package is spread over a few years, to be obligated by fall 2024 (perhaps spend and spread out over even longer) and b) not permanent. It will go away, when what we really need is a sustained increased investment.
It is important to understand though, that states – especially those which currently put up very little effort of their own, should have to share some of the cost of closing these gaps. The needed increase in federal aid to close these gaps would be significantly reduced by requiring all states to put up their fair share and allocate aid to local districts appropriately according to need. This figure, from our visualizations on the site shows that states which put up more effort to fund their schools tend to have more adequate spending. Shocking, I know!

It’s also important to understand that if we want to shoot higher, it’s going to cost more. A lot more. Here’s what the funding gaps look like if we shoot for current Massachusetts average outcomes:
Let’s take a relatively average state, for example, like Missouri. An average state, but one with extremes. I had the pleasure of speaking to school administrators in Missouri about a week ago. On average, school spending per pupil across Missouri school districts really doesn’t vary much by poverty. The funding is not progressive. And on average, it’s relatively average.

St. Louis and Kansas city have somewhat elevated funding, but high poverty districts overall, not so much. If we compare these current expenditures to costs of achieving national average outcomes, we have …

That is, to provide equal opportunity to achieve national average outcomes, which aren’t too different from Missouri average outcomes would take doubling or more the per pupil spending of low spending high poverty districts, but low poverty districts could actually spend less, quite a bit less to achieve national average outcomes (which are much lower than their current achievement). For example, from our new visualizations… Clayton, an affluent suburb of St. Louis spends well above what it needs to achieve merely national average outcomes, and far exceeds those outcomes.

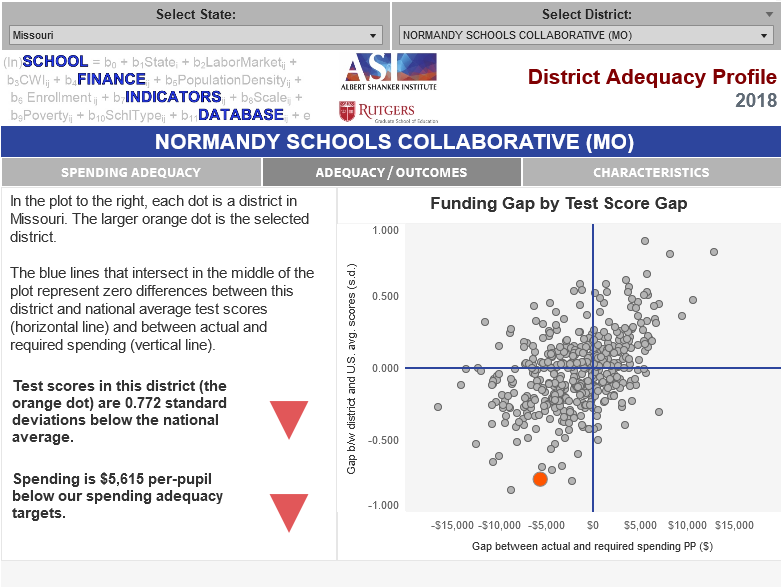
By contrast, right down the road… Normandy schools have significant gaps in spending and outcomes.
A few additional points which aren’t included in our new reports and site are a) how much more it would cost to achieve higher outcomes and b) the influence of racial isolation and segregation on costs. First, here’s how much the cost targets go up in Missouri if we shoot for Massachusetts average outcomes:

Shooting for Mass average outcomes, only Missouri’s lowest poverty districts currently spend enough to achieve the target and the per pupil costs for the state’s major cities climb to over $35,000 per pupil.
Prior research has shown that if we include racial composition directly in these models we may get different cost projections and thus funding gaps. Specifically, black population concentration resulting from structural, systemic racism, housing and school segregation can lead to even higher costs of mitigating outcome disparities.
If we re-estimate our models to each standard, with and without racial composition (in this case, % black enrollment) we get these results. For Normandy, for example, the non-race model (which we use in our new report) estimates a cost of national average outcomes in 2018 of $18,774. But, when racial composition is considered, Normandy which is a nearly 100% black school districts, has costs per pupil of nearly $26,000 to achieve national average outcomes.

These issues require further exploration and integration into what Preston Green and I have recently laid out as a reparations framework for school finance. Racial composition, as in our past work, continues to significantly affect the cost of achieving common outcome goals. Because of this, it remains a significantly unfair playing field to rate and rank districts on outcome metrics, when we have failed to fully address these different costs. It’s also simply unfair to the children subjected to these conditions and a constitutional violation under many state constitutions to deprive these children of equal opportunity to achieve common, adequate outcome levels.
Our new project is intended to help users, policymakers and advocates better understand these need and cost differences. Our focus is on the relative position of districts and states in the mix. And again, we are estimating against a low bar. It should not be construed that this bar – the outcome basis for our estimates – constitutes constitutional educational adequacy in any state’s particular context. States have their own standards. State courts have in many cases determined whether those outcome standards determine the constitutional standard and by extension the legislature’s obligation to finance districts to meet those standards. But many states, courts and legislatures have ducked these questions altogether over time. And we’ve never really had a robust national discussion on what it might take to raise the bar nationally, and where we have the furthest to go.
Here, we offer a starting point and one that hopefully helps change the conversation, and guide future federal aid programs as we move to the post-covid era!
This blog post has been shared by permission from the author.
Readers wishing to comment on the content are encouraged to do so via the link to the original post.
Find the original post here:
The views expressed by the blogger are not necessarily those of NEPC.
