Class Size & Funding Inequity in NY State & NY City
New York State repeatedly makes the top of our list of most INEQUITABLE state school finance systems in our National Report Card.
http://www.schoolfundingfairness.org/National_Report_Card_2012.pdf
Further, NY State was acknowledged in a report I prepared last year, with colleague Sean Corcoran of NYU, identifying states that are both generally inequitable and that actually exacerbate those inequities through their state school finance systems.
http://www.americanprogress.org/wp-content/uploads/2012/09/StealthInequities.pdf
As I’ve explained in several previous blog posts, NY State’s primary policy response has been to brush aside the issue – blame school districts for being inefficient – pretend that the state already spends way too much – and ram ill-conceived policies down the throats of local district officials.
Here’s one choice quote from the Governor:
“The problem with education in New York is not money,” Cuomo said. “We have one of the highest spending rates in the nation. Our performance isn’t where our money is.”[1]
Of course, it’s not about money. Couldn’t possibly be. If Scarsdale has enough, they must all have enough. If New York districts spend, on average, more than New Mexico districts, it has to be more than enough.
But these are meaningless comparisons. Cost pressures in education are primarily local/regional. Education is a labor intensive industry. Salaries must be competitive on the local/regional labor market to recruit and retain quality teachers. And for children to have access to higher education, they must be able to compete with peers in their region. And within any region, children with greater needs and schools serving higher concentrations of children with greater needs require more resources – more resources to recruit and retain even comparable numbers of comparable teachers – and more resources to provide smaller class sizes and more individual attention.
More information on how and why money matters can be found here:
http://www.shankerinstitute.org/images/doesmoneymatter_final.pdf
Here’s one snapshot of spending disparities in downstate/NYC/Long Island (identified by Regional Cost Index Region). Remember – on average – higher need districts generally require more financial support per pupil to move toward comparable outcomes. Here, along the horizontal axis, we have district rates of children qualified for free or reduced lunch compared to the average district in their “core based statistical area” (basically, metro area). Along the vertical axis, we have the Approved Operating Expense per Pupil, relative to the average district in the CBSA. Now, in a “fair” system, the pattern would tilt upward from left to right. Not in NY.
Figure 1
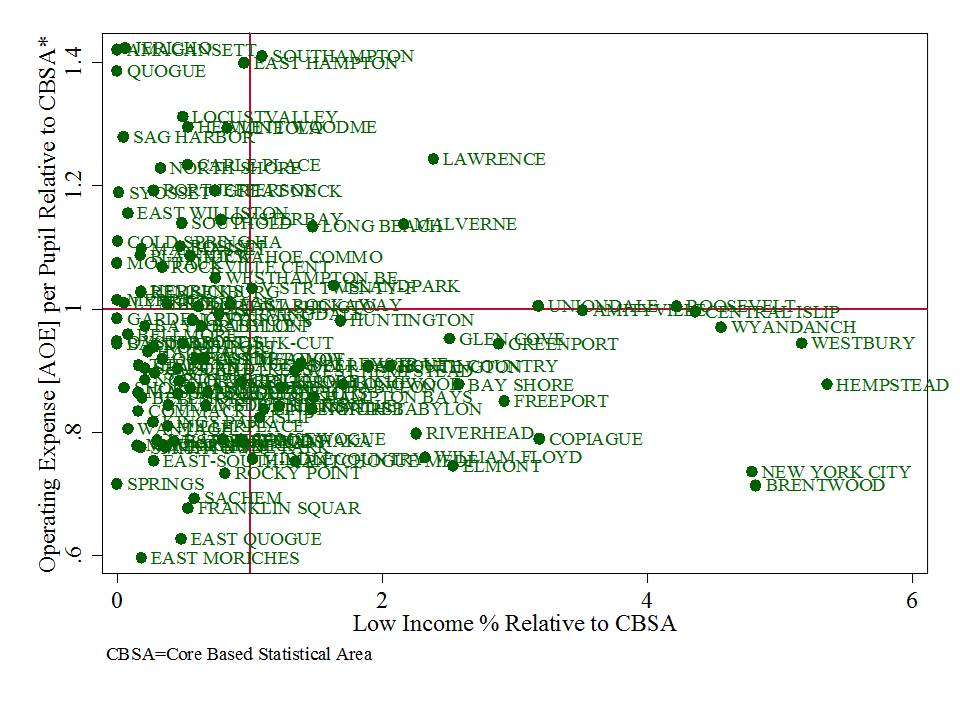
What we see here is that many districts having several times the average low income concentration as their surrounding districts also spend much less than the average of their surrounding districts.
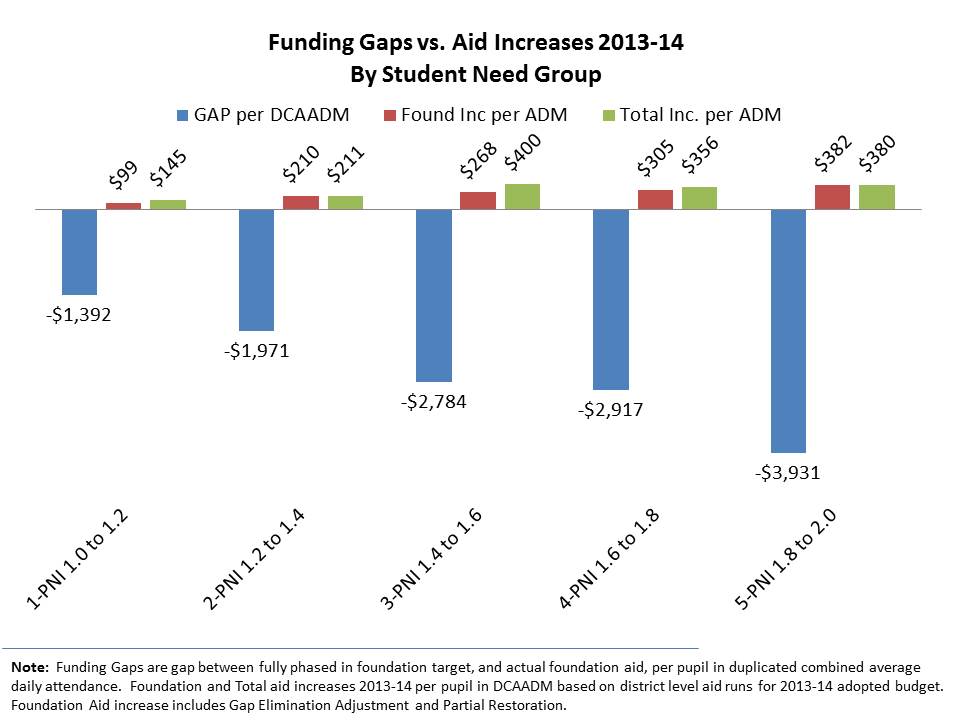
Now, state policymakers have been patting themselves on the back of late for their supposed generous increases to state aid for the coming year. The following graph puts those increases into context. As I’ve explained in previous posts, NY State has failed for years to even come close to funding it’s state general aid formula. The graph below organizes districts into quintiles by student need – from low need districts to high need districts based on the state’s own pupil need index (driven largely by low income population shares). The blue bars show how much less state aid than promised, each group is receiving on average. The red and green bars show the aid increases for the coming year. They barely make a dent in the current underfunding of the state’s own formula (which sets a very low bar to begin with).
Figure 2
So then, what are the consequences of this? Michael Rebell and colleagues at Teachers College put out a series of papers last Fall/Winter discussing essential resources, where the essential resource benchmarks are derived from an earlier court order in Campaign for Fiscal Equity v. State.
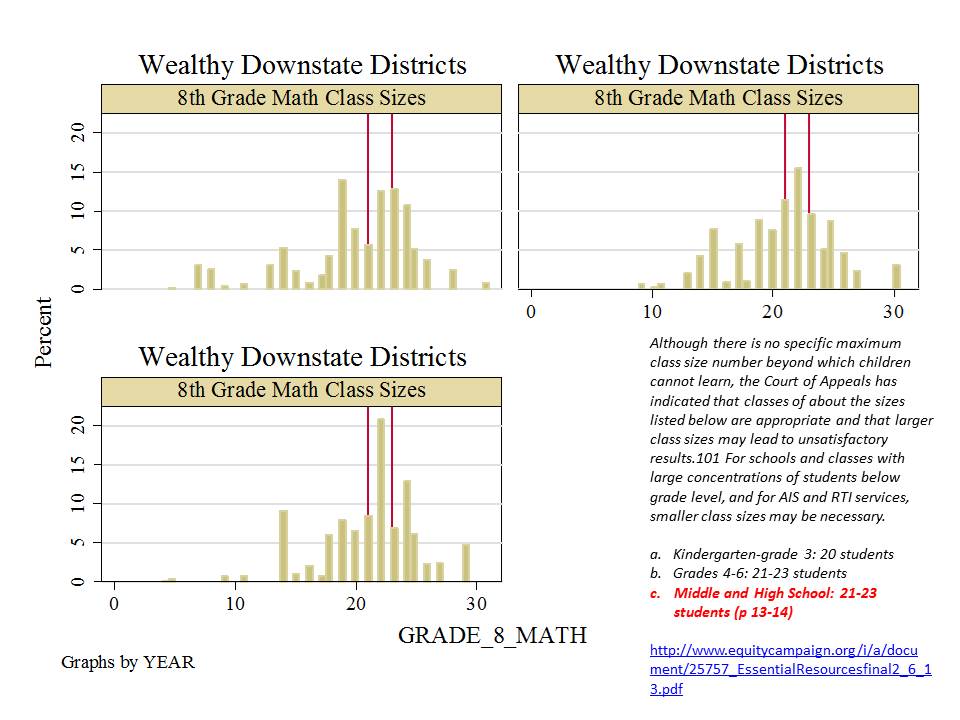
Although there is no specific maximum class size number beyond which children cannot learn, the Court of Appeals has indicated that classes of about the sizes listed below are appropriate and that larger class sizes may lead to unsatisfactory results.101 For schools and classes with large concentrations of students below grade level, and for AIS and RTI services, smaller class sizes may be necessary.
Kindergarten-grade 3: 20 students
Grades 4-6: 21-23 students
Middle and High School: 21-23 students (p 13-14)
The next two figures use the recently released NYSED 2012 school report cards to characterize the percent of children attending schools with average class sizes above certain thresholds – specifically, those identified in Rebell’s essential resources analysis. I have put schools into quintiles, statewide, using percent free or reduced price lunch.
Figure 3. Elementary Class Sizes

Figure 4. Middle School Class Sizes
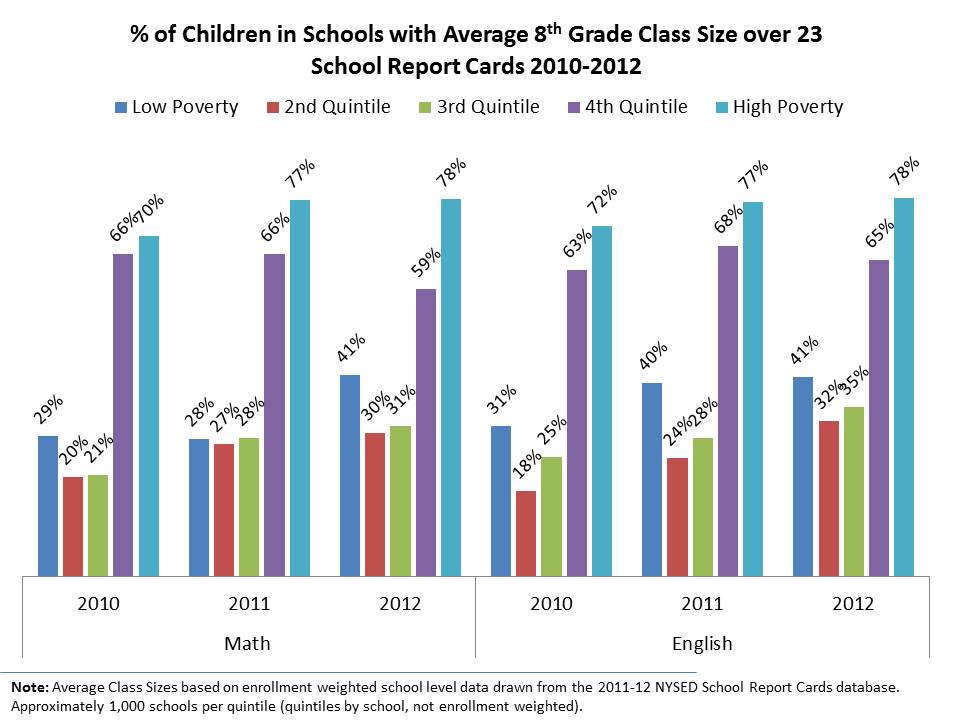
Two findings here are notable.
- First, that high poverty schools which most need smaller class sizes tend to have higher proportions of children in larger classes.
- Second, it’s getting worse, not better as a function of the state’s failure to fund high poverty schools appropriately.
What’s most offensive here is that – while this has occurred during a time of recession – it is presently occurring in a context where the Governor continues to proclaim that schools – all schools – any schools – certainly these schools – have more than enough money to get the job done. Further, these patterns are occurring in a context where the state continues to squander billions in state funding on lower need districts, as explained in our Stealth Inequities report.
Conditions are particularly dire in New York City. The next several graphs present the frequency distributions of the percent of children in schools by average class size – for elementary and middle schools. Here, I also present the class size distributions of schools in districts in the top wealth/income quintile in the NYC metro area. Red vertical lines indicate the essential resources thresholds.
Figure 5. Elementary Class Sizes in NYC
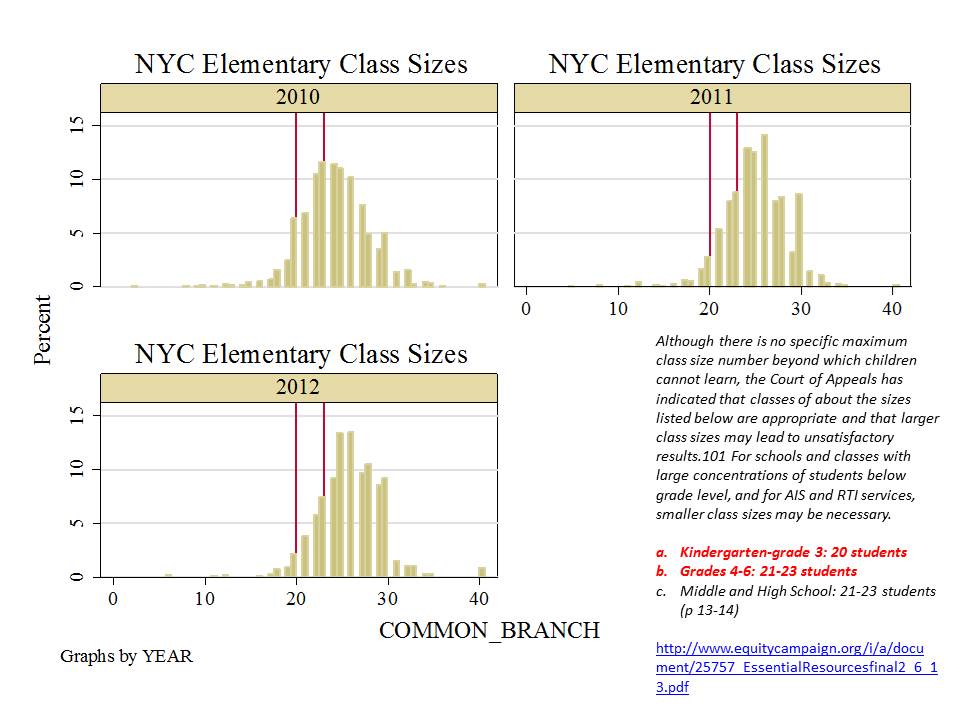
Figure 6. Elementary Class Sizes in Wealthy Districts in Region
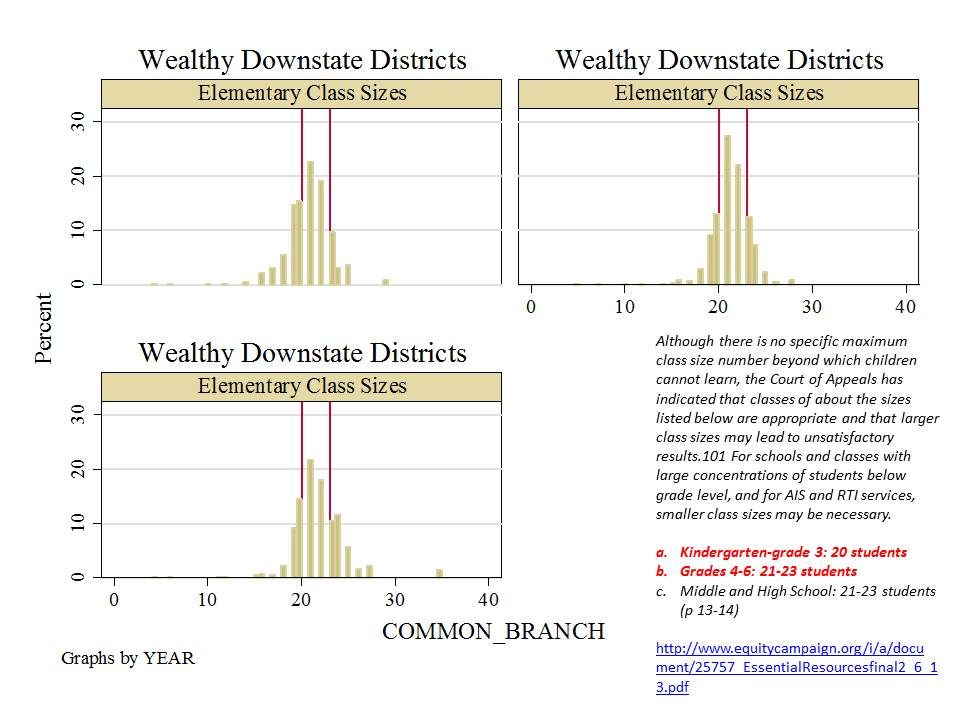
Figure 7. Middle School Class Sizes in NYC
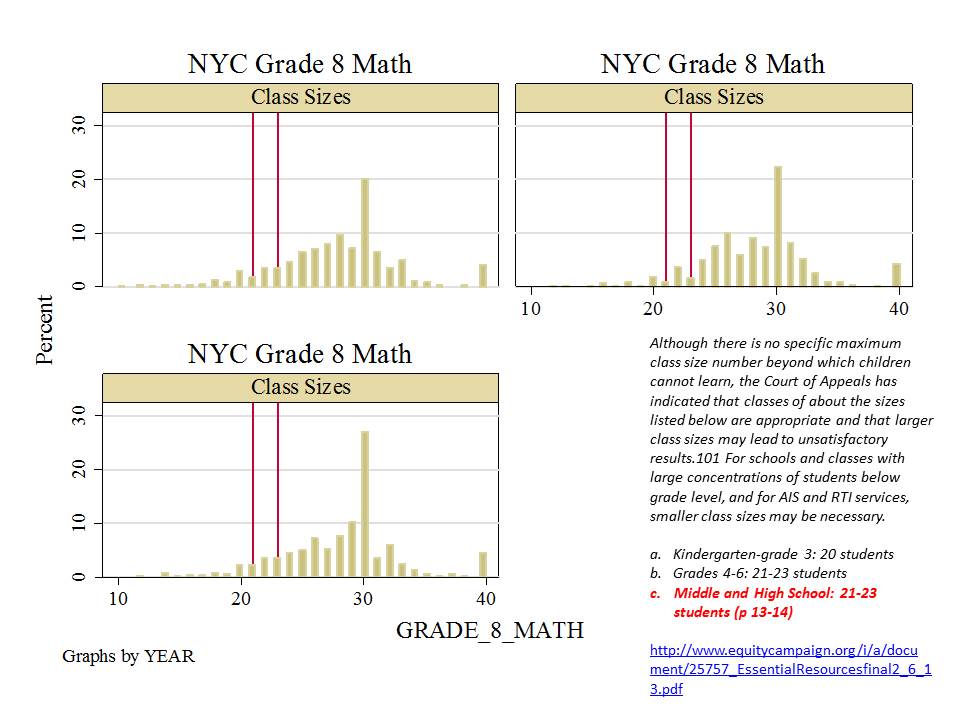
Figure 8. Middle School Class Sizes in Wealthy Districts in Region
What is notable here is that:
- class sizes in NYC schools continue to increase over time.
- class sizes in NYC schools are much larger than those in the top wealth/income quintile
- Further, compared to essential resources thresholds, class sizes in NYC are freakin’ huge! Yeah… that’s a technical term for you… freakin’ huge!!!!!
For those hack pundits who’ve latched on to the “uncertainty” or “narrowness” of research on the effectiveness of class size reduction (& bogus characterizations of “cost effectiveness”), there is little if any justification for permitting class sizes in high poverty settings at 30 or higher. Further, class size, and total student load are a relevant working condition influencing teacher recruitment/retention.
In simpler terms, there is certainly little basis for the inequity here. From a simple fairness standpoint, it makes little sense that children in the top 20% districts by wealth and income should have access to such smaller classes than children in New York City and that these disparities should year after year be a byproduct of the state’s dysfunctional, inequitable school finance system and overblown false claims that serve to maintain that status quo!
This blog post has been shared by permission from the author.
Readers wishing to comment on the content are encouraged to do so via the link to the original post.
Find the original post here:
The views expressed by the blogger are not necessarily those of NEPC.
