Radical Eyes for Equity: New SAT, but Same Old Problems
While South Carolina has joined several states in rejecting Common Core for public school standards and testing, one powerful legacy remains, the revised SAT.
An original architect of the Common Core, David Coleman, now heads the College Board and has championed the new SAT, partly as more aligned with the Common Core.
Paul Hyde’s recent coverage of Greenville high schools’ scores on the revised test as well as a piece on charter schools and the SC Governor’s School for the Arts and Humanities offers a prime opportunity to address a new test but the same old problems.
Many advocating the new SAT have suggested that changing the test could address the large and persistent score gaps along race, social class, and gender lines.
However, reporting in Education Week, Catherine Gewertz reveals: “The 2017 SAT scores show inequities similar to those of earlier years. Asian (1181), white (1118), and multiracial (1103) students score far above the average composite score of 1060, while Hispanic (990) and African-American (941) students score significantly below it.”
For Greenville county as we consider the newest data and our urge to rank high schools by average SAT scores, we must once again confront some important facts that simple ranking tends to mask:
- SAT average scores should never be used to rank schools, districts, or states in terms of academic quality; this caution, in fact, comes from the College Board itself.
- SAT scores remain most strongly correlated with parental income, parental levels of education, gender (average male scores are higher than female scores), race, and access to courses.
- SAT scores are designed solely to be predictive for college success (not to measure academic quality of any school or state); however, high school GPA has long been a better predictor than the test.
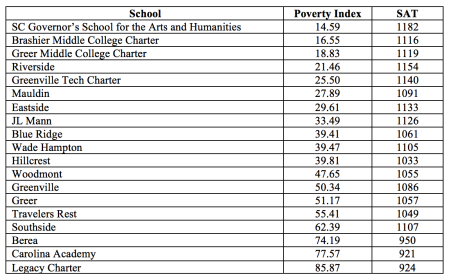
Therefore, we should not rush to interpret rankings of Greenville county schools by SAT scores that correlate primarily with the poverty index (PI) of each school as well as a careful analysis of which students in each school take the test.
For example, praising Riverside (PI 21.46) along with Greenville Tech Charter (PI 25.50), Greer Middle College Charter (PI 18.83), Brashier Middle College Charter (PI 16.55), and SCGSAH (PI 14.59) without acknowledging that high SAT scores are mostly a reflection of incredibly low poverty rates is a misleading suggestion of achievement being linked to school quality.
Not ranking and judging our schools by SAT data, however, is not enough. Instead we need to end entirely our toxic relationship with high-stakes testing because that process remains deeply inequitable.
Too many students are spending far too much time in and out of school mired in test-prep and test taking. In that context, we take the test scores far too seriously, typically misinterpreting them.
High-stakes test scores are mostly markers for race, social class, and gender; and are in only small ways reflections of achievement. Most standardized test data are 60% or more correlated with factors outside the schools, teachers, and students.
Test-prep and test taking are detracting from time better spent addressing the inequity of access most students suffer in terms of high-quality teachers and challenging courses. In SC and across the U.S., impoverished students, black and brown students, and English language learners are cheated with larger class sizes, inexperienced and uncertified teachers, and remedial (test-prep) courses.
By identifying the top high schools and bottom high schools according to average SAT scores, we are masking that all schools in the county tend to house social and community differences embodied by the students that attend those schools.
This does not mean we do not need education reform; but it does mean we need to reform our approaches to reform. Throughout the state, we need the political will to address crippling social issues related to food insecurity, stable work and housing, and healthcare, but we also need the political will to stop changing standards and tests every few years and, instead, confront directly the inequities of our schools (such as tracking and teacher assignments) that mirror the inequities of our communities.
And thus, the SAT is one part of the larger standards and testing era that inordinately drains our schools of time and funding that should be better spent elsewhere, notably in ways that address the inequity of access noted above.
We have much to praise and much to lament in Greenville county schools. SAT scores are not in either category since the new test brings with it the same old problems we refuse to name and then address.
Coda
Highlighted in red above, the point I made needs a bit more explanation.
I considered posting a separate blog titled “The Politics of Lazy Data Analysis,” but opt instead to expand on that briefly here.
The essential flaw in reporting average SAT scores and then using them to rank schools is that such reporting is simultaneously factual and misleading. As the chart below shows, ranking a group of high schools is doable and not essentially false since the scores are accurate.
While discussing the reporting with a friend who is a nurse and only knows about educational debates through mainstream media, my friend said that he noticed newspapers love charter schools, and from what he reads and hears, he believes charter schools are better than traditional schools.
And so, with the follow-up article on charter schools and the SCGSAH, we confront again that lazy data analysis combined with the aggressive self-promotion of charter schools produces a false narrative about charter schools somehow being superior than traditional public schools.
Instead, another just slightly less lazy analysis of the data below could be presented as “Local Low-Poverty High School Outperforms Low-Poverty Charter Schools on SAT.”
But even adding the Poverty Index to average SAT scores ignores that we are still not necessarily comparing equal populations of test takers: What about English language learner percentages and which students have taken college-level courses better aligned with SAT questions? What about percentages of test takers who have paid for SAT-prep training outside of school?
Finally, however, as noted above, the great flaw with any analysis of SAT data is grounded in the unavoidable fact that the SAT is not designed to measure school or teacher quality and that SAT scores mostly reflect factors other than academic achievement.
The politics of lazy data analysis, then, often uses actual facts while misrepresenting important topics: The implication that charter schools are outperforming traditional schools is simply not true. If we can or should try to determine what schools are academically effective, then using SAT data is a deeply misguided venture.
This blog post has been shared by permission from the author.
Readers wishing to comment on the content are encouraged to do so via the link to the original post.
Find the original post here:
The views expressed by the blogger are not necessarily those of NEPC.