School Finance 101: From NJ Ed Policy Forum: On Average, Are Children in Newark Doing Better?
Bruce D. Baker & Mark Weber, Rutgers University, Graduate School of Education
November 16, 2015
Baker.Weber.NewarkBetterOff.NJEPF.11_15_15
In this research note, we estimate a series of models using publicly available school level data to address the following question:
Q: Did students in Newark (combined district and charter) make gains on statewide averages (non-Newark) on state assessments, controlling for demographics?
Specifically, we evaluate changes in mean scale scores on state assessments (NJASK) for language arts and math grades 6 to 8.
Newark Reforms Since 2009
Schools in the city of Newark have undergone a series of disruptive reforms since 2009, including substantial increases in the numbers of children served in charter schools, adoption of a unified enrollment system, ratification of a performance based teacher contract, and school closures, reconstitutions and reorganization.[i]Some of these reforms were instituted following the much publicized gift of Facebook founder Mark Zuckerberg, chronicled in Dale Russakoff’s The Prize.[ii]
A commonly asked question in the aftermath of these disruptions is whether students in Newark on the whole are better off than they were before these reforms? That is, were the disruptions and resulting political turmoil worth it? Some have chosen to speculate, based largely on anecdotal evidence, that children in Newark must be better off today than before these disruptive reforms.
Chris Cerf, former NJ Commissioner of Education and current State Superintendent of Schools for the Newark Public Schools, asserts that the past few years have brought significant positive changes for Newark’s schools:
“Whether the measure is graduation rates, improved instructional quality, last year’s improvement in the lowest-performing schools targeted for special intervention, a nation-leading new collective-bargaining agreement, the addition of many new high-quality public schools, increased parental choice, or a material increase in the proportion of effective teachers, the arrow is pointed decidedly up in Newark.
“To be sure, as is always the case, the evidence of improvement is textured and in some respects uneven. The many positive indicators and trend lines, however, paint a picture of hope and progress that is completely at odds with the pessimism that has made its way into the standard storyline.”[iii]
Tom Moran, Editorial Page Editor of the Star-Ledger and a consistent supporter of the Newark reforms, writes: “The growth of charters has not damaged the kids in the traditional system. In fact, they’ve made modest improvements.”[iv]In a post on his Facebook page, Mark Zuckerberg, whose $100 million gift was the catalyst for the NPS reforms, writes: “No effort like this is ever going to be without challenges, mistakes and honest differences among people with good intentions. We welcome a full analysis and debate of lessons learned. But it is important that we not overlook the positive results.”[v]The chief-of-staff for Cory Booker, former mayor of Newark and current U.S. senator who was instrumental in secure Zuckerberg’s donation, states: “Newark students are quite simply better off now than they were five years ago.”[vi]
In these conversations, “better off” is often reduced to whether or not, on average, across district and charter schools, student test scores for children in Newark have improved. That is, are students achieving more than they otherwise would have, had there been no such disruptions? It remains far too soon to measure longer term outcomes, including graduation rates, college attendance or economic outcomes.
While we are unable to compare against what might have been in the absence of reforms, we can at least evaluate whether children in Newark have made progress when compared to statewide averages, controlling for student population characteristics.
Data
To make these comparisons we use a school level data set including measures from 2009 to 2014, most of which are publicly available – downloadable from the New Jersey Department of Education web site:
- Mean scale scores by subject and year[vii]
- Shares of low income (% free lunch) children and ELL[viii]
- City of school location[ix]
Web-based data do not include school level shares of children classified as having disabilities. We have obtained those data via request. Because of the volatility of year to year school level measures of disability populations, we have used three year averages in our analyses (for this measure only).
Among the most significant changes over time in the city of Newark has been the expansion of numbers of children served in the city’s charter schools, and adoption of a unified, citywide enrollment system for assigning children to charters.
Figure 1 shows the shares of valid scale scores for charter schools (as a percent of citywide valid scale scores) on state assessments. For grades 6 and 7, the share of valid test scores (for data included in our analyses) in Newark that are for children attending charter schools rise from around 18% to 25% or more from 2009 to 2014. The share of valid test scores for 8th grade assessments also rises, but somewhat less.
Figure 1

Statewide, the share of valid test scores coming from children attending charter schools is much lower, rising to just over 2%.
Figure 2

Models
Assessing whether or not mean scores in Newark as a whole are rising faster or slower than mean scores for schools statewide other than Newark is relatively straightforward statistically (whether meaningful or not is another question entirely). To address this question, we estimate the following model:
Scale Scorest = b0 + b1Year + b2Newark + b3Year x Newark + b4LowIncomest + b5ELLst + b6Disabilitys+ est
Where scale scores for school “s” at time “t” are the dependent variable, and where we run separate models for each scale score. For each school statewide, we include measures of the share of children who qualify for free lunch, under the national school lunch program, shares of children who are limited in their English language proficiency and shares of children classified as having disabilities. As such, we am comparing changes in the relative position of Newark children to non-Newark children of similar demographics.
Scale scores for any subject and grade level tend to drift over time. As such, we include a set of “year” dummy variables which pick up that drift (more later). We also include a “Newark” dummy variable assigned to every district and charter school in Newark. The coefficient on this dummy variable will tell us whether the average score for children in schools in Newark is different from the average scale score for children not in Newark, controlling for demographics.
Of particular interest here is the interaction term of “Year x Newark.” The coefficients on this term will tell me whether, for each year, the scores of children in Newark have closed the gap (relative to the baseline year of 2009) when compared with children not in Newark, controlling for demographics.
Grade level differences are accounted for by modeling each subject by grade level assessment separately. We focus on grades 6 through 8 (rather than 3 through 5) to capture cumulative effects of schooling.
All models are weighted for school counts of valid test takers. Models are estimated with robust standard errors to account for the fact that repeated measures on schools over time are not independent.[x]
Findings
Table 1 shows the results of the regression models. Starting with demographic effects, the models show us that as we move from a school with 0% to 100% special education students, the average 6th grade language arts scores drop by over 50 points. More realistically, as we move from about 10% to about 20% children with disabilities, average scale scores drop by about 5 points. Similarly, as we move from 0% low income to 100% low income, mean scale scores in 6th grade language arts are about 42 points lower. Demographic disparities in math tend to be greater than in language arts on these assessments.
Table 1

Turning to the coefficients of interest: First we see that the “year” dummy variables have many significant coefficients. These represent average score differences from the baseline year of 2009. For example, for 6th grade math, we see than in 2010, average scores were 1.42 points higher than in 2009. In 2011, they were 6.31 points higher than in 2009. The margins grow up through 2014. These coefficients represent a strong upward drift in Math 6 scores from 2009 to 2014. It is that drift against which changes in Newark scores must be measured. Math scores in general show stronger upward drift than language arts within the New Jersey data.
The “Newark” coefficients show that on average, after accounting for demographics, scale scores for Newark are a few points higher than statewide, but only statistically significant for Language Arts in 8th grade. Now for the interaction term: The interaction term tells us whether Newark schools on the whole (charters and district combined, where ¼ of scores are contributed by charters at the end of the period), are gaining on, losing ground or staying in the same relative position to other schools statewide. Since Newark schools on average are ahead of schools statewide (controlling for demographics), the question is whether they open up that lead, hold it, or lose it.
A quick summary of the coefficients in Table 1, focusing on the end of the period, tells us that in 2013 and 2014, Newark schools had gained no ground on schools statewide- period. Statistically, in terms of these measured outcomes, Newark children are not better off in their aggregate, compared to peers statewide than they were in 2009. They are also no worse off.
The figures that follow illustrate the changes in Newark scores compared to statewide scores for each assessment over time. To generate these figures we use the coefficients in Table 1 to calculate predicted values of the scale scores for Newark and non-Newark schools holding other measures constant. For example, we set all demographics to 0, such that the projected scale scores represent the scale scores of Newark and non-Newark schools at 0% low income, 0% ELL and 0% special education. This is why the average scale scores appear high. But all that’s relevant here are the relative position of Newark and non-Newark scores. We could have adjusted everything downward by setting all demographics to 100% (100% low income, 100% ELL and 100% disability). That would have simply lowered the level of the lines on all graphs but kept their trends and relative positions the same.
Each figure shows that scores of Newark children did jump in 2011 in some cases opening up a statistically significant gap with non-Newark children. In some cases the gap is increased as much if not more so by a drop in scores of non-Newark children. 8th grade language arts is the only assessment addressed here which does not show that 2011 change.
But the apparent change in 2011 immediately disappears, such that by the end of the period – by 2014 – there are no differences in Newark students’ performance than students statewide and no gains made by Newark students compared to students statewide. On most assessments, from 2011 to 2014, Newark scores seem to flat-line or even drop.
Figure 3

Figure 4

Figure 5
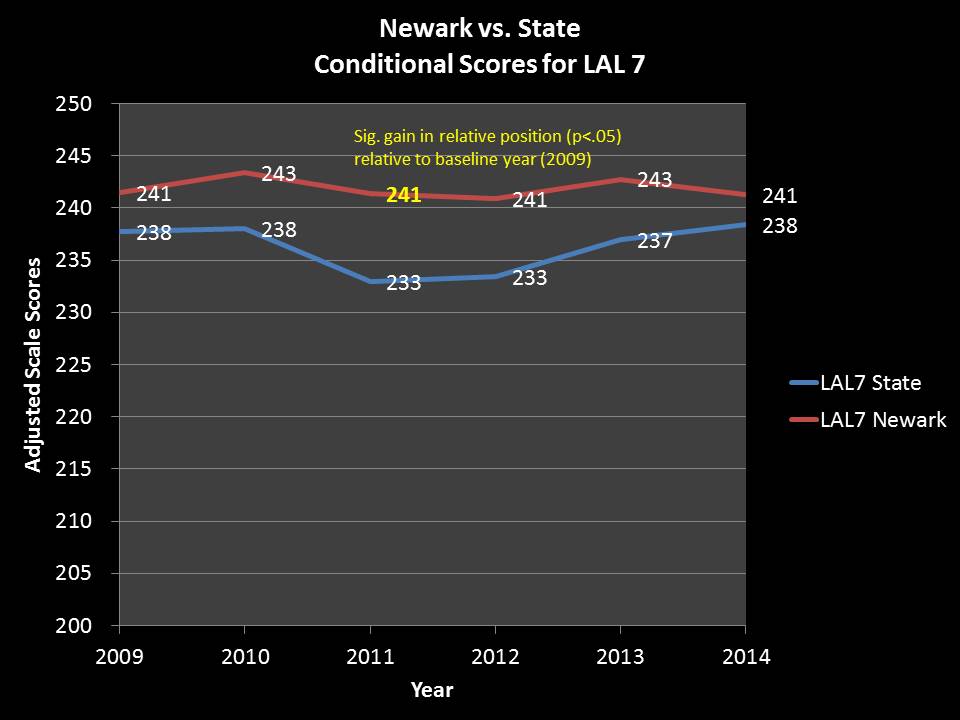
Figure 6

Figure 7

Figure 8

Conclusions
In a recent interview, Russakoff stated that she did not believe Newark’s students are better off today than they were five years ago: “…it feels like a wash.”[xi]The analysis herein, while admittedly narrow in scope and short in time frame perspective, finds that Russakoff is correct. Average state assessment scores in grades 6, 7 and 8 are pretty much right where they were – relative to non-Newark students – in 2009.
Follow-up analyses are certainly warranted, but limited by changes in state outcome measures.
NOTES
[i]Weber, M. (2015) Empirical Critique of One Newark: First year update. New Jersey Education Policy Forum. https://njedpolicy.wordpress.com/2015/03/12/empirical-critique-of-one-newark-first-year-update/
[ii]Russakoff, Dale (2015) The Prize: Who’s in charge of America’s schools? New York: Houghton Mifflin Harcourt
[iv]http://www.nj.com/opinion/index.ssf/2015/09/newark_moran.html
[v]https://www.facebook.com/zuck/posts/10102461248065941?fref=nf
[vi]http://www.nj.com/essex/index.ssf/2015/11/newark_power_brokers_back_zuckerbergs_school_donat.html
[vii]http://www.nj.gov/education/schools/achievement/prior.htm
[viii]http://www.nj.gov/education/data/enr/
[ix]http://education.state.nj.us/directory/
[x]http://www.ats.ucla.edu/stat/stata/webbooks/reg/chapter4/statareg4.htm
[xi]http://www.nj.com/opinion/index.ssf/2015/09/author_dale_russakoff_discusses_new_book_on_newark.html
This blog post has been shared by permission from the author.
Readers wishing to comment on the content are encouraged to do so via the link to the original post.
Find the original post here:
The views expressed by the blogger are not necessarily those of NEPC.
