School Finance 101: Reality Check: Trends in School Finance
Over the next few months, I plan to share some rough drafts of forthcoming work – Here, I present a brief reality check on what is often referred to as the “long term trend” argument proving that money doesn’t matter for schools. Here’s Bill Gates’ version of that argument:
Over the past four decades, the per-student cost of running our K-12 schools has more than doubled, while our student achievement has remained virtually flat. Meanwhile, other countries have raced ahead.[i]
Bill Gates, Microsoft co-founder
[i] http://www.washingtonpost.com/wp-dyn/content/article/2011/02/27/AR2011022702876.html
Reality Check
Here, I look at long term national trends in actual student outcomes and in school resources. Recall that the need for disruptive reform and magic elixirs derives primarily from our massive increases in spending coupled with our virtually flat student outcomes over time. But are those claims even remotely correct?
Richard Rothstein of the Economic Policy Institute immediately critiqued Bill Gates’ assertions of “virtually flat” student outcomes in a memo titled “Fact-Challenged Policy.” Rothstein (2011) shows that, in fact, “On these exams [National Assessment of Educational Progress], American students have improved substantially, in some cases phenomenally.” (p. 1)[i] Related work by Rothstein and colleague Martin Carnoy (2013) confirms that, when accounting for differences in student disadvantage, U.S students perform much better than what is suggested by commonly cited, unadjusted rankings that fail to account for changes in subgroup proportions when aggregating test results.[ii]
In 2010, Educational Testing Service (ETS) released “The Black-White Achievement Gap: When Progress Stopped,” a report by Paul Barton and Rich Coley (2010), in which the authors explored the Black-White achievement gap from the 1970s to recent years.[iii] The goal of that report was to explore trends in Black-White achievement gaps, and changing conditions which may explain those trends. Barton and Coley explained that “From the early 1970s until the late 1980s, a very large narrowing of the gap occurred in both reading and mathematics, with the size of the reduction depending on the subject and age group examined.” (p. 7) Reductions to achievement gaps were particularly pronounced in reading among 13 and 17 year olds, while still significant in mathematics. However, “During the 1990s, the gap narrowing generally halted, and actually began to increase in some cases.” (p. 7). The authors note some additional gap narrowing from 1999 to 2004 and mixed findings from 2004 to 2008. Rothstein (2011) shows that, even during the period from 1990 to 2008, achievement gains for Black 4th and 8th grade students have been substantial in mathematics in particular, and have outpaced their White peers.[iv]
Figure 3 displays the long term trends for black and white children at age 13 on the NAEP Long Term Trend assessment. Both black and white scores trend upward, and, as noted by Barton and Coley, Black scores increase significantly from the 1970s through 1990.
Figure 3
NAEP long term trends on reading and math for 13 year olds
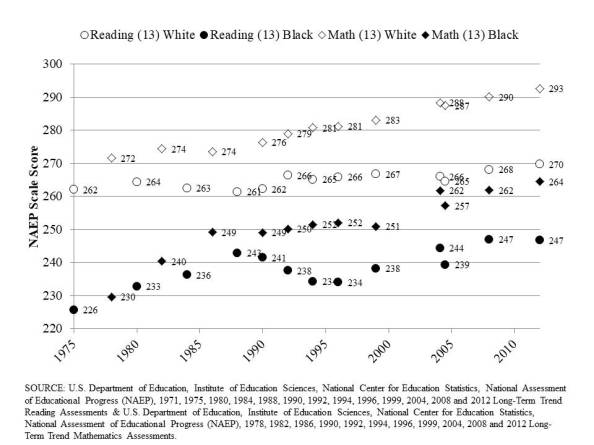
Figure 4 shows more recent trends for children by income status for Reading and Figure 5 shows the trends for math at 4th and 8th grade. For reading, fourth grade scores have continued to trend upward for all groups, but for eight graders, dip slightly in 2015. For math, the overall upward trend is also consistent across grades, but also with a dip in 2015. It would be premature to assume any causation for the 2015 dip.
Figure 4
NAEP reading by income status
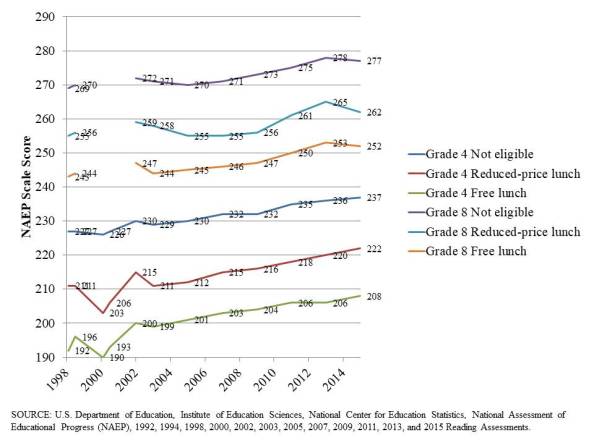
Figure 5
NAEP math by income status
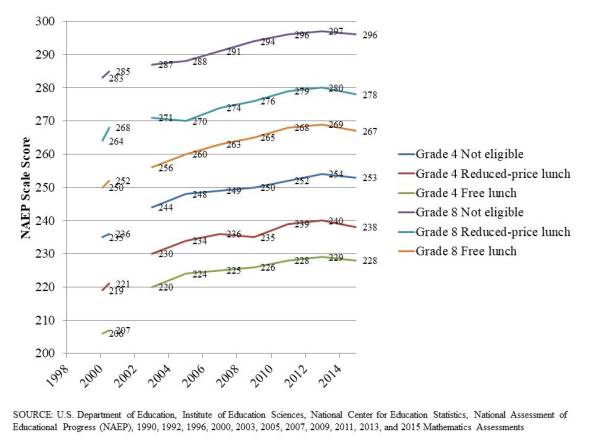
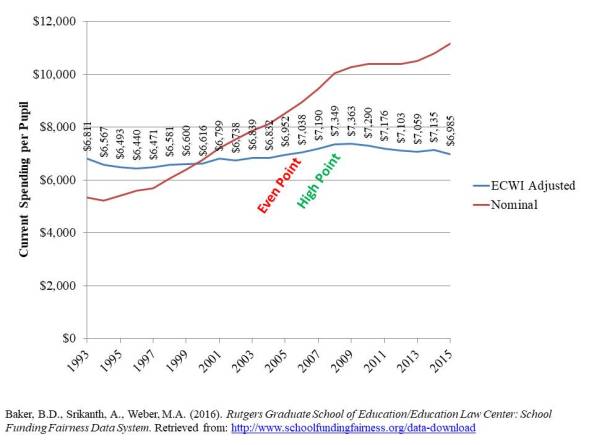
Figure 6 compares nominal (not inflation adjusted) current spending per pupil to current spending per pupil adjusted for the costs of maintaining competitive wages over time. The previous figure – THE GRAPH – uses a consumer price index, which is less appropriate for evaluating the value of the education dollar over time. By 2015, the average school district nationally was roughly at a 10 year break-even point on per pupil spending. That is, per pupil spending hasn’t risen for a decade and has barely risen for over two decades (2.5%). So, no, school spending is not dramatically increasing over time and has declined in real terms from 2009 to 2015, the most recent national district level data.
Figure 6
Current Operating Expenditures per Pupil Adjusted for Labor Costs
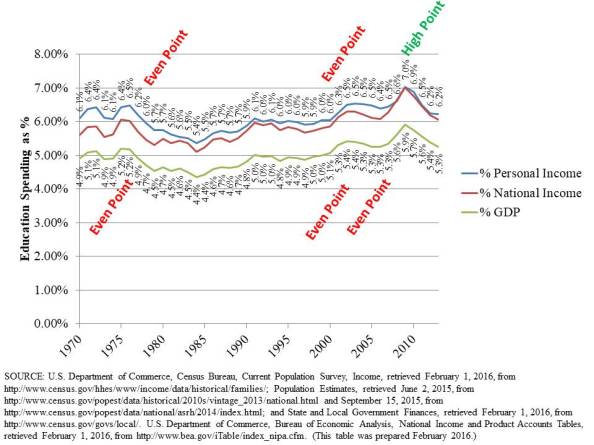
Over the longer term, Figure 7 shows that direct government expenditure on elementary and secondary education as a share of gross domestic product has oscillated over decades but is presently about where it was both 15 years earlier (2000) and 40 years earlier (1975). That is, education spending is not outstripping our economic capacity to pay for it.
Figure 7
Direct Education Expense as a Share of Gross Domestic Product
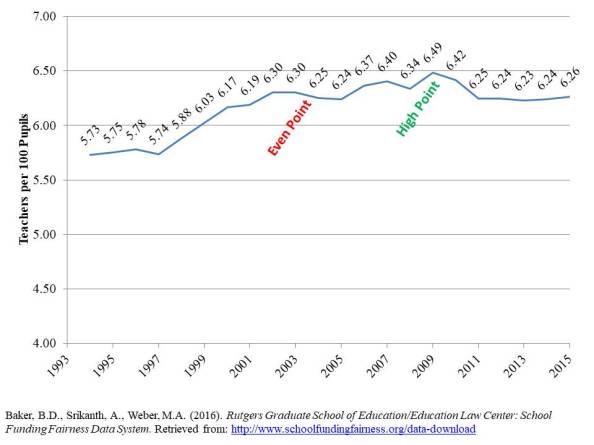
Some have asserted that along with ballooning spending over time has been a staffing surge. That is, schools have hired more and more people and have especially hired more and more individuals with less direct classroom contact time – administrative and support staff, including specialists.[v] There is some truth to the fact that teaching specialist and school level administrative positions have increased over time, in part because of additional legal protections for specialized programs and services for children with disabilities.[vi] But, as Figure 8, which includes all staff classified as teachers (specialists among them), total numbers of teachers per each 100 pupils are at a break-even point from about 12 to 14 years prior (2001 to 2003). That is, since the early 2000s (when NAEP progress seemed to slow down), teaching staff have remained relatively stagnant. There was a modest bump in the mid-2000s, which subsided during the “new normal” period and has not since rebounded. Notably, a recent comprehensive meta-analysis of interventions which improve outcomes for low income students found specifically that the most effective interventions were those involving increased human resources.[vii]
Figure 8.
Teachers (all) per 100 pupils over time
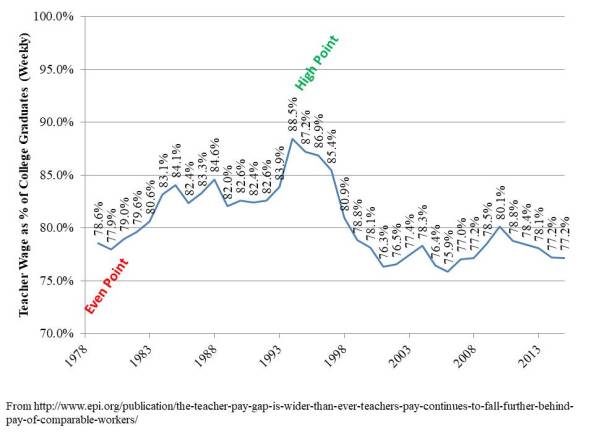
Finally, Figure 9 shows the ratio of teacher weekly wages to those of college educated non-teachers from 1979 to 2015, estimated by authors from the Economic Policy Institute. For the past 15 years, teacher wages have held constant at about 77% of non-teacher wages. Some assert that teacher’s healthy and growing pension benefits are a substantial offset to this gap, noting that teacher benefits as a share of teacher wages have increased from about 10% to about 20% of wages since the early 2000s, whereas private sector benefits have held constant at 10% wages. [viii] One problem is that the difference is expressed in percent terms, and the supposed 20% rate for teachers is over a wage that is 23% lower to begin with. Of course, it’s a larger and growing percent of a lower and declining wage. Even taking that percent at face value as correct, would at best raise teacher wages to about 84% of non-teacher wages in 2015.[ix]
Figure 9
Ratio of teacher weekly wages to college educated non-teacher weekly wages
To summarize:
- NAEP scores have increased substantively over the long term, but have slowed in growth more recently, as has closure of racial achievement gaps;
- School spending has been relatively stagnant for the past decade and so too have staffing quantities and the competitiveness of teacher wages;
- Over the shorter term, since 2008, spending, staffing and wage competitiveness have all declined.
These long term trends are roughly the opposite of those used most often to proclaim the failures of American education. One implication of these trends is that U.S. public schools have, in fact, become more efficient over time, not less.
[i] Rothstein, R. (2011). Fact-Challenged Policy. Policy Memorandum# 182. Economic Policy Institute.
[ii] Carnoy, M., & Rothstein, R. (2013). What do international tests really show about US student performance. Economic Policy Institute, 28.
[iii] Barton, P. E., & Coley, R. J. (2010). The Black-White Achievement Gap: When Progress Stopped. Policy Information Report. Educational Testing Service.
[iv] On these exams, American students have improved substantially, in some cases phenomenally. In general, the improvements have been greatest for African-American students, and among these, for the most disadvantaged. The improvements have been greatest for both Black and White 4th and 8th graders in mathematics. Improvements have been less great but still substantial for Black 4th and 8th graders in reading and for Black 12th graders in both mathematics and reading. Improvements have been modest for Whites in 12th grade mathematics and at all three grade levels in reading (Rothstein, 2011).
[v] Scafidi, B. (2012). The School Staffing Surge: Decades of Employment Growth in America’s Public Schools. Friedman Foundation for Educational Choice.
[vi] Roy, J. (2012). Review of The School Staffing Surge. National Education Policy Center, 3
[vii] As summarized by ANOVA blogger Frederik DeBoer here: https://fredrikdeboer.com/2017/05/16/study-of-the-week-what-actually-helps-poor-students-human-beings/ see also: Dietrichson, J., Bøg, M., Filges, T., & Klint Jørgensen, A. M. (2017). Academic interventions for elementary and middle school students with low socioeconomic status: A systematic review and meta-analysis. Review of Educational Research, 87(2), 243-282.
[viii] http://www.uaedreform.org/downloads/2017/04/employer-contributions-for-retirement-4-4-17.pdf
[ix] Teacher Weekly Wage2015 = $1,092 x 1.20 = $1,311
College Graduate Weekly Wage2015 = $1,416 x 1.10 = $1,557
Adjusted Share = 84%
This blog post has been shared by permission from the author.
Readers wishing to comment on the content are encouraged to do so via the link to the original post.
Find the original post here:
The views expressed by the blogger are not necessarily those of NEPC.
