School Finance 101: “Urban” Poverty and “Racial” Achievement Gaps are So Yesterday? Not!
I’ve been meaning to write about this issue for some time. But every time I get around to it, it seems no-longer timely. It’s also not a hugely popular issue, nor one that’s very sexy or controversial from a policy standpoint. But it lingers and re-emerges every now and then.
Well, thanks to this article in The Atlantic, it’s timely again! Once again we are presented with the assertion that suburban poverty is the major policy concern of today – implicitly overshadowing “urban” poverty. Urban poverty is so yesterday! And again, we are presented with a picture of “suburban poverty” as flourishing among abandoned and decaying suburban sprawl (2,500 to 3,000 sq ft single family homes built on ¼ acre lots, perhaps in the 1990s on cul-de-sacs, etc.).[1] This picture is deceptive at best, and amazingly this portrayal is not uncommon.
In this post, I address two examples of what I consider statistical smoke and mirrors (in one case coupled with false imagery) used in recent years to re-frame debates over economic and educational “equality” – toward a “post-urban” and “post-racial” domestic policy agenda.
Two oft repeated claims in recent years are that:
- suburban poverty now exceeds urban poverty, in total numbers and thus as a policy concern; and
- income achievement gaps far exceed racial achievement gaps on standardized tests.
Thus, we must appropriately refocus the policy agenda, and related resources toward the suburbs and toward mitigating (and for that matter, measuring and evaluating) income achievement gaps, rather than racial achievement gaps. These claims may seem innocuous enough, but they do have significant implications for policy design, including the targeting and allocation of precious resources, and how we view (and respond to) the sorting and reshuffling of student populations by race and income status (state and federal aid to schools).
Suburban Poverty?
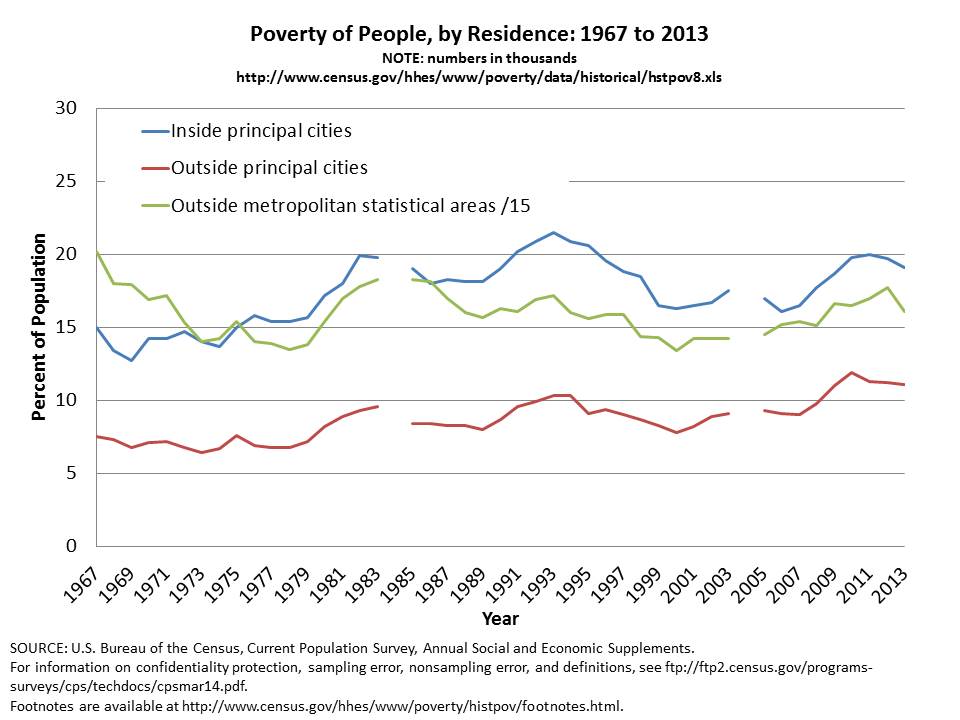
Assertions of suburban poverty overtaking urban poverty as a central policy concern are often validated by one form or another of this graph:
Figure 1.The “Suburban Poverty” Validation Graph
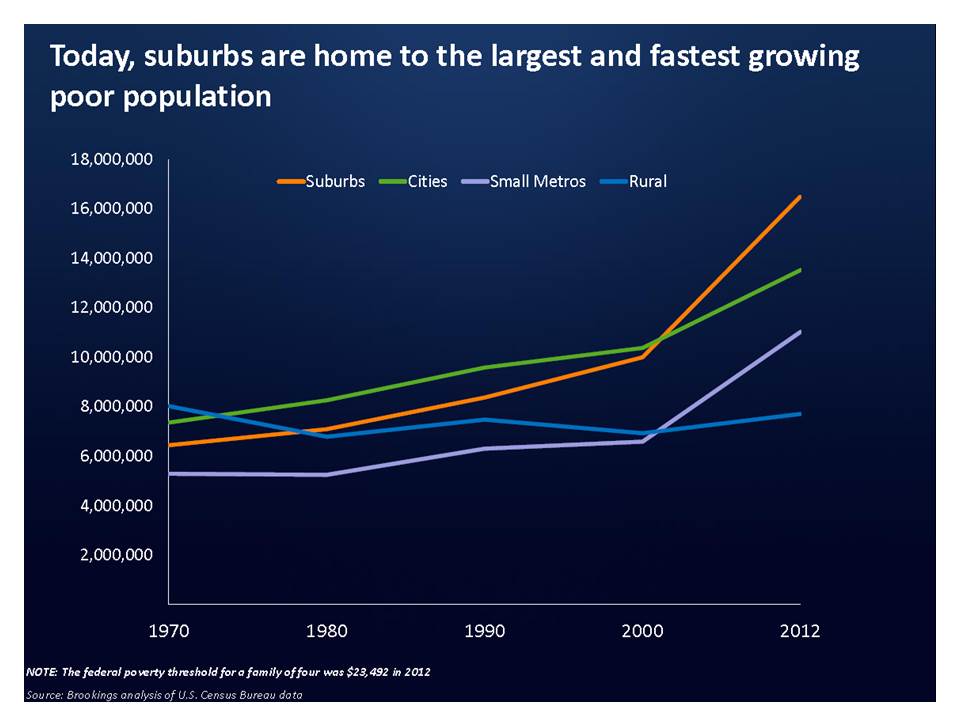
A version of this graph is used to make the claim in the Atlantic article that we now have three million more poor Americans living in suburbs than in cities! And thus, suburban poverty now rules the day!
It may be true that the aggregate number of individuals in poverty in areas classified by the Census Bureau as “suburbs” exceeds the aggregate number of individuals in poverty living in areas classified as “urban.” But, it’s still the case that the RATE of poverty in urban areas, as classified by the Census Bureau, continues to exceed the RATE of poverty in suburban areas.
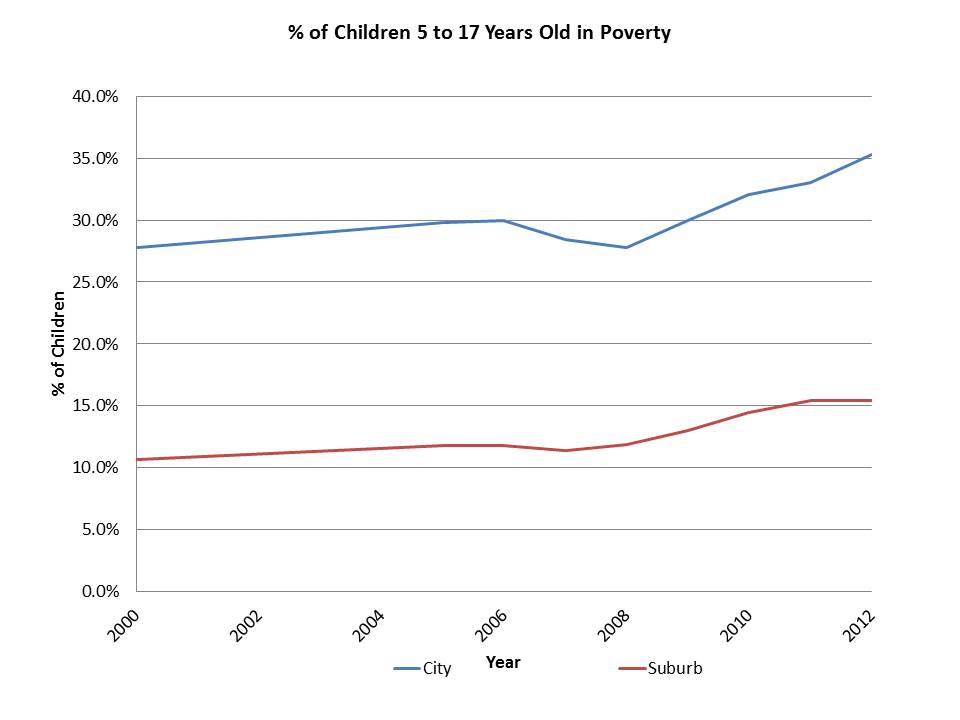
Figure 2 displays urban and suburban poverty rates for the families of children between the ages of 5 and 17. Notably, just as with the overall population, in the past few years, the total number of children living in poverty in areas classified as “suburbs” has surpassed the total number in areas classified as “urban.”
By 2013, poverty rates for the total population in urban areas in the U.S. were 19.1% compared to 11.1% in suburbs, with change patterns over time mirroring those for children (Figure 2) but a somewhat lower levels. [in fact, these data suggest that “suburban” poverty never actually surpassed urban poverty, even in aggregate numbers] Long term trends below.
Figure 2.Rate of Poverty among children in Suburban and Urban Areas (American Community Survey)
An even more fine grained perspective is presented for school enrollment data, nationally, in Figure 3, breaking out areas into more fine grained categories:
Figure 3. School Enrollments of Children from Low Income Families by Urban Centric Locale Code

Clearly, as indicated in Figure 3 – poverty in the suburbs is not the “big” problem. Suburban schools, ON AVERAGE, remain the lowest in poverty concentration (with the exception of rural districts on the fringes of metropolitan areas). Large City schools have by far the highest concentrations of low income children.
What’s a suburb anyway?
Note that the distinction “suburban” itself, which then dictates how these tallies play out, is a Census distinction that may or may not align well with the general public’s view of “suburbia.” Suburbs range from the nearest inner urban fringe immediately adjacent to large cities, to outermost exurbia, where sprawl dominates.
Most older inner-urban-ring suburbs certainly are not dominated by sprawling 2,500 to 3,000 sq ft homes on cul-de-sacs. To clarify, for New Jersey folks, East Orange and Irvington are “Suburbs” by Census designation. For Chicago readers, all of those small segregated enclaves on the south side are Suburbs. And in St. Louis, Ferguson, Normandy, Wellston, Riverview Gardens, etc. are Suburbs, at least in a Census Bureau technical, geospatial sense.
I’ll set aside for another day the measurement of poverty and how appropriate corrections may alter these findings!
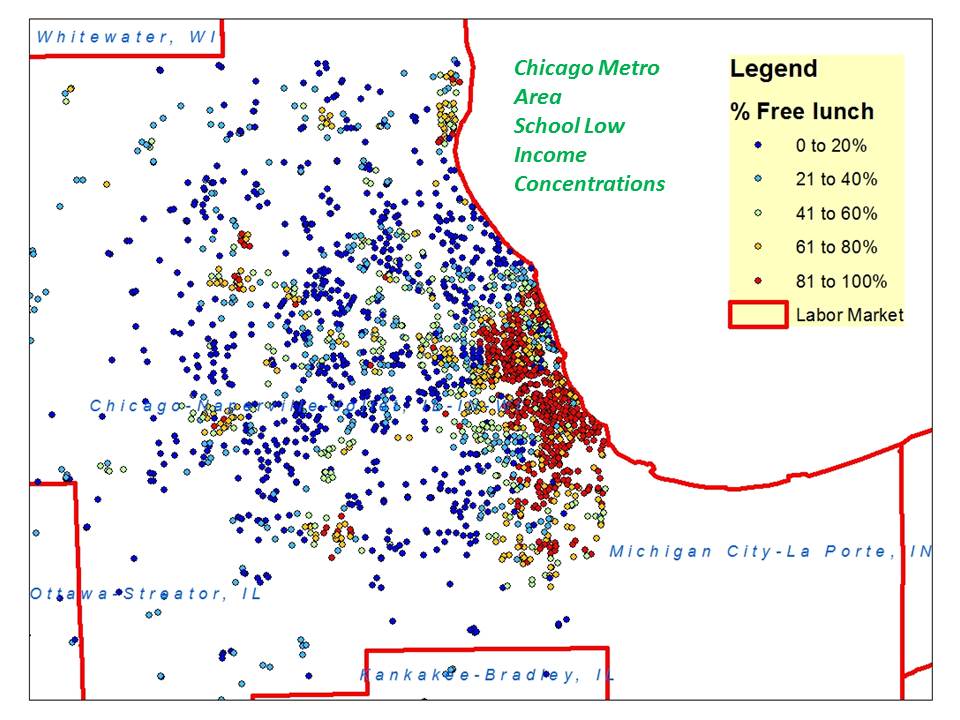
Let’s take a stroll through a handful of our nation’s major metropolitan areas. Again, I’m going to jump to school data, because that’s what I had readily available for mapping. First, let’s look at school level concentrations of low income children in the Chicago metro area, without any artificial boundaries drawn to identify the city, or its suburbs. High poverty schools are concentrated on some areas, low poverty ones in others. The contrasts are pretty striking. We can guess what’s a suburb and what’s a city, but the official classifications might not line up so well with our guesses.
Figure 4. Chicago School Poverty without Boundaries
Now let’s throw in some boundaries and identifiers of “suburbs” versus “urban” or central city areas. Are we really to assume that poverty in aging south side suburbs is the form of “suburban” poverty being characterized in popular media? Long term under-employed, white couples with 2.5 children going upside-down on their mortgages on over-sized homes built on undersized lots? Uh, no! I suspect (actually, I’ve got a whole bunch of related data on this) that the “poverty” we are seeing here, in what are classified as “suburbs” is more what the average Joe would characterize as “urban” poverty (where “urban” is often code for “black”).
Figure 5. Chicago with Boundaries

Now let’s look at the Philly metro area, over the past 10 years (of available data). In Figure 6, the upper left are school level low income concentrations in 2001 and in the upper right, in 2011. Yes, we do see increases in low income concentrations in many schools. But what we especially see, are increases from high, to very high poverty in the urban core, and in two outlying “small cities” (Allentown and Reading to the northwest). Yes, we do see some moderate increases in poverty rates among previously lower poverty suburban schools. But, as the graph in the lower half of the figure shows, urban poverty rates remain much higher, and suburban poverty very low – on average.
Figure 6. Philly Metro School Low Income Concentrations over Time

And what do the neighborhoods in these inner urban fringe “suburbs” actually look like – and how do they compare with media portrayals of “suburbs” versus “urban” areas? Much of the public confusion here is fueled by perceptions of “urban” meaning high-rise, very high density low income housing projects and “suburban” meaning sprawling cul-de-sacs. But here are a few visuals I gathered from street level view on Google Maps, showing areas classified as “urban” versus nearby areas classified as “suburban.”
Figure 7. Newark vs. East Orange

Figure 8. Chester vs. Philadelphia
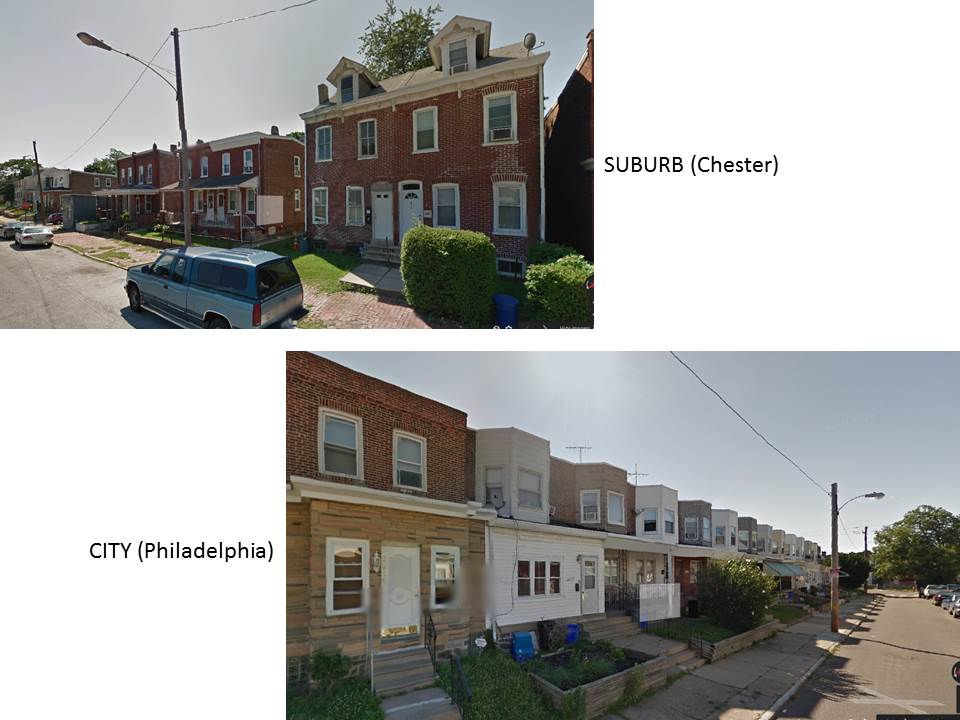
Figure 9. St. Louis vs. University City

In other words, there’s a fine line – if any, and a few blocks walking distance – between the high poverty settings of major cities and the high poverty areas formally classified as suburbs.
While I don’t mean to totally blow off concerns over rising poverty in the “suburbs” I certainly do mean to cast doubt – serious doubt – on how suburban poverty has been portrayed in the media and popular think tanky reports (and web sites), and the policy implications of that messaging. Put bluntly –
- Poverty rates remain much higher in urban areas than in “suburbs”
- That which we are now counting as “suburban” poverty is in many if not most cases more like the “urban” poverty that has plagued large and mid-sized city neighborhoods for decades
- What we are characterizing as suburban poverty – in media imagery – isn’t the same thing we are counting!
Income Achievement Gaps?
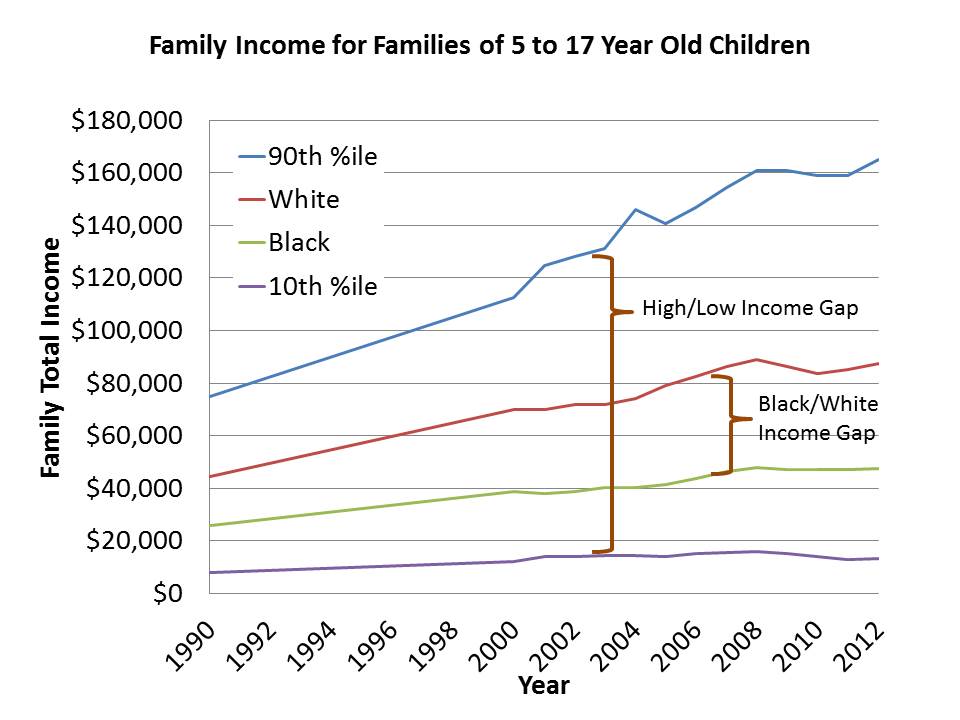
This issue is inextricably linked to the previous, in that issues surrounding child poverty and all that flows from it, historically, AND TO THIS DAY, have strong racial correlates. The assertion that income achievement gaps now dwarf racial achievement gaps is most often rooted in this finding from Sean Reardon of Stanford University [from a chapter in an exceptional book titled: Whither Opportunity]:
The achievement gap between children from high- and low-income families is roughly 30 to 40 percent larger among children born in 2001 than among those born twenty-five years earlier.” Further, “the income achievement gap (defined here as the average achievement difference between a child from a family at the 90th percentile of the family income distribution and a child from a family at the 10th percentile) is now nearly twice as large as the black-white achievement gap.[2]
And thus, income achievement gaps are of greater policy importance. Except that the income achievement gap measured here is based on setting arbitrary and rather extreme cut-points along the income distribution. Reardon’s comparison of an income achievement gap between the 90th and 10th percentile family income to the black-white achievement gap is deceptive, and largely inappropriate. One would certainly expect the achievement gap among children from the highest and lowest income groups to be larger than the achievement gap between black and white children, if the family income gap between black and white children is nowhere near as large. Further, achievement gaps at the income extremes would be expected to grow faster to the extent that income gaps at the achievement extremes are growing faster.
Figure 10 shows that the income gap at the poles is, clearly much larger, and growing faster than the income gap between blacks and whites.
Figure 10.Black White Income Gaps vs. 90/10 Income Gaps
Not surprisingly, income gaps matter for explaining achievement gaps – where income gaps are larger, so too tend to be outcome gaps. The same is true at the intersection of income and race. Where the income gap between blacks and whites is larger, the racial achievement gap is larger. For example, Figure 11 shows that in 2011, states with larger income gaps between families of black and white children have larger test score gaps between those children. States with very larger income gaps between black and white families, like Connecticut, Wisconsin and Pennsylvania, have large achievement gaps and states with smaller income gaps, like West Virginia, have smaller achievement gaps between black and white children.
Figure 11. Black White Income Gaps Determine Black White Achievement Gaps

Notably, Sean Reardon has written extensively over time about racial achievement gaps. But it is this recent work that seems to have caught media attention and has been used to urge a shift in emphasis from racial to income achievement gaps. This may not be Reardon’s intent, but the inappropriate comparison of gaps made above lends itself to this argument.
Policy Implications
But why does any of this matter? We know there are achievement gaps in relation to income. We know there are income gaps by race. We know there’s poverty in urban areas and the suburbs, and we know that poverty is merely a blunt classification of income status. So why can’t we just leverage policies to tackle income inequality and all that flows from it, while being urbanicity-neutral and race-blind in the process?
Good policy design requires more nuance than this. A substantial body of literature validates that race in-and-of-itself matters (for educational and economic outcomes), above and beyond income variation that may be associated with race. Further, when it comes to leveraging resources, context matters, including the intersections of poverty, race and population density (determined by distribution of housing stock). For example, my own research and that of others has found that racial composition and population density independently influence the costs of achieving common outcome goals.[3]
Developing effective and efficiently targeted policies for achieving more equitable educational outcomes, and ultimately more equitable economic outcomes requires that we understand what we mean when we say “suburban” or “urban” and don’t just rely on media images (or the sloppy research claims behind them), and perhaps, if necessary, that we construct relevant classifications that do appropriately characterize what we mean to characterize.
The current policy agenda and media interest around suburban poverty in particular is largely misinformed by a complete failure to even bother to understand the operational definition of “suburb” (or for that matter, the measurement of “poverty”). Thoughtful policy design requires that we better understand how income and poverty measures relate to the context in which they are measured.[4] Perhaps most importantly, we should always scrutinize carefully that which is presented as some sort of sea change in the demographic, economic or policy landscape. Most large scale change of this sort occurs slowly, not quickly. It’s boring (for many) and requires patient, long term observation. That’s just the way it is.
Notes:
[1] Notably, a recent report from the Center for American Progress paints a somewhat more accurate view, at least in terms of the housing stock, age and location where “suburban poverty” has been on the rise.
[2] http://t.www.skylinecollege.edu/sparkpoint/about/documents/reardonwhitheropportunity-chapter5.pdf
[3] Baker, B. D. (2011). Exploring the sensitivity of education costs to racial composition of schools and race-neutral alternative measures: A cost function application to Missouri. Peabody Journal of Education, 86(1), 58-83.
[4] Baker, B. D., Taylor, L., Levin, J., Chambers, J., & Blankenship, C. (2013). Adjusted Poverty Measures and the Distribution of Title I Aid: Does Title I Really Make the Rich States Richer?. Education Finance and Policy, 8(3), 394-417.
Long Term Trends

This blog post has been shared by permission from the author.
Readers wishing to comment on the content are encouraged to do so via the link to the original post.
Find the original post here:
The views expressed by the blogger are not necessarily those of NEPC.
