VAMboozled!: The “Widget Effect” Report Revisited
You might recall that in 2009, The New Teacher Project published a highly influential “Widget Effect” report in which researchers (see citation below) evidenced that 99% of teachers (whose teacher evaluation reports they examined across a sample of school districts spread across a handful of states) received evaluation ratings of “satisfactory” or higher. Inversely, only 1% of the teachers whose reports researchers examined received ratings of “unsatisfactory,” even though teachers’ supervisors could identify more teachers whom they deemed ineffective when asked otherwise.
Accordingly, this report was widely publicized given the assumed improbability that only 1% of America’s public school teachers were, in fact, ineffectual, and given the fact that such ineffective teachers apparently existed but were not being identified using standard teacher evaluation/observational systems in use at the time.
Hence, this report was used as evidence that America’s teacher evaluation systems were unacceptable and in need of reform, primarily given the subjectivities and flaws apparent and arguably inherent across the observational components of these systems. This reform was also needed to help reform America’s public schools, writ large, so the logic went and (often) continues to go. While binary constructions of complex data such as these are often used to ground simplistic ideas and push definitive policies, ideas, and agendas, this tactic certainly worked here, as this report (among a few others) was used to inform the federal and state policies pushing teacher evaluation system reform as a result (e.g., Race to the Top (RTTT)).
Likewise, this report continues to be used whenever a state’s or district’s new-and-improved teacher evaluation systems (still) evidence “too many” (as typically arbitrarily defined) teachers as effective or higher (see, for example, an Education Week article about this here). Although, whether in fact the systems have actually been reformed is also of debate in that states are still using many of the same observational systems they were using prior (i.e., not the “binary checklists” exaggerated in the original as well as this report, albeit true in the case of the district of focus in this study). The real “reforms,” here, pertained to the extent to which value-added model (VAM) or other growth output were combined with these observational measures, and the extent to which districts adopted state-level observational models as per the centralized educational policies put into place at the same time.
Nonetheless, now eight years later, Matthew A. Kraft – an Assistant Professor of Education & Economics at Brown University and Allison F. Gilmour – an Assistant Professor at Temple University (and former doctoral student at Vanderbilt University), revisited the original report. Just published in the esteemed, peer-reviewed journal Educational Researcher (see an earlier version of the published study here), Kraft and Gilmour compiled “teacher performance ratings across 24 [of the 38, including 14 RTTT] states that [by 2014-2015] adopted major reforms to their teacher evaluation systems” as a result of such policy initiatives. They found that “the percentage of teachers rated Unsatisfactory remains less than 1%,” except for in two states (i.e., Maryland and New Mexico), with Unsatisfactory (or similar) ratings varying “widely across states with 0.7% to 28.7%” as the low and high, respectively (see also the study Abstract).
Related, Kraft and Gilmour found that “some new teacher evaluation systems do differentiate among teachers, but most only do so at the top of the ratings spectrum” (p. 10). More specifically, observers in states in which teacher evaluation ratings include five versus four rating categories differentiate teachers more, but still do so along the top three ratings, which still does not solve the negative skew at issue (i.e., “too many” teachers still scoring “too well”). They also found that when these observational systems were used for formative (i.e., informative, improvement) purposes, teachers’ ratings were lower than when they were used for summative (i.e., final summary) purposes.
Clearly, the assumptions of all involved in this area of policy research come into play, here, akin to how they did in The Bell Curve and The Bell Curve Debate. During this (still ongoing) debate, many fervently debated whether socioeconomic and educational outcomes (e.g., IQ) should be normally distributed. What this means in this case, for example, is that for every teacher who is rated highly effective there should be a teacher rated as highly ineffective, more or less, to yield a symmetrical distribution of teacher observational scores across the spectrum.
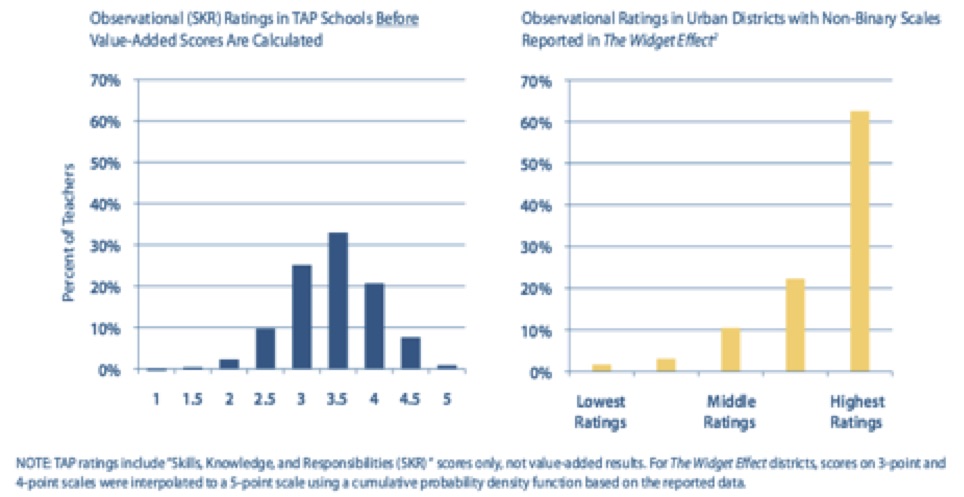
In fact, one observational system of which I am aware (i.e., the TAP System for Teacher and Student Advancement) is marketing its proprietary system, using as a primary selling point figures illustrating (with text explaining) how clients who use their system will improve their prior “Widget Effect” results (i.e., yielding such normal curves; see Figure below, as per Jerald & Van Hook, 2011, p. 1).
Evidence also suggests that these scores are also (sometimes) being artificially deflated to assist in these attempts (see, for example, a recent publication of mine released a few days ago here in the (also) esteemed, peer-reviewed Teachers College Record about how this is also occurring in response to the “Widget Effect” report and the educational policies that follows).
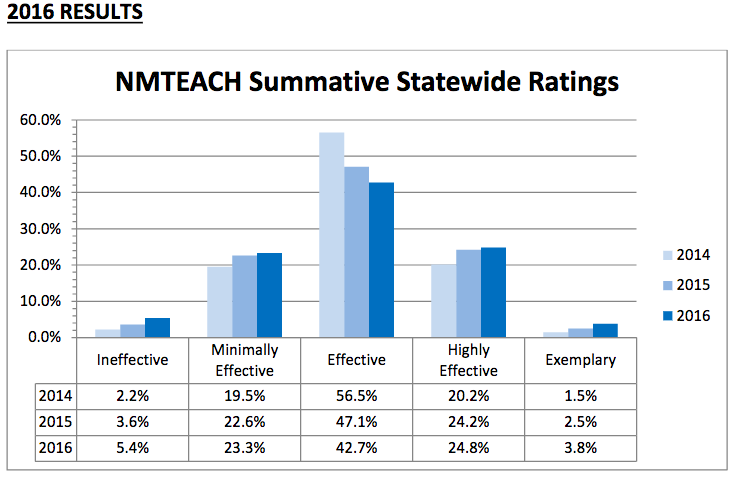
While Kraft and Gilmour assert that “systems that place greater weight on normative measures such as value-added scores rather than…[just]…observations have fewer teachers rated proficient” (p. 19; see also Steinberg & Kraft, forthcoming; a related article about how this has occurred in New Mexico here; and New Mexico’s 2014-2016 data below and here, as also illustrative of the desired normal curve distributions discussed above), I highly doubt this purely reflects New Mexico’s “commitment to putting students first.”
I also highly doubt that, as per New Mexico’s acting Secretary of Education, this was “not [emphasis added] designed with quote unquote end results in mind.” That is, “the New Mexico Public Education Department did not set out to place any specific number or percentage of teachers into a given category.” If true, it’s pretty miraculous how this simply worked out as illustrated… This is also at issue in the lawsuit in which I am involved in New Mexico, in which the American Federation of Teachers won an injunction in 2015 that still stands today (see more information about this lawsuit here). Indeed, as per Kraft, all of this “might [and possibly should] undercut the potential for this differentiation [if ultimately proven artificial, for example, as based on statistical or other pragmatic deflation tactics] to be seen as accurate and valid” (as quoted here).
Notwithstanding, Kraft and Gilmour, also as part (and actually the primary part) of this study, “present original survey data from an urban district illustrating that evaluators perceive more than three times as many teachers in their schools to be below Proficient than they rate as such.” Accordingly, even though their data for this part of this study come from one district, their findings are similar to others evidenced in the “Widget Effect” report; hence, there are still likely educational measurement (and validity) issues on both ends (i.e., with using such observational rubrics as part of America’s reformed teacher evaluation systems and using survey methods to put into check these systems, overall). In other words, just because the survey data did not match the observational data does not mean either is wrong, or right, but there are still likely educational measurement issues.
Also of issue in this regard, in terms of the 1% issue, is (a) the time and effort it takes supervisors to assist/desist after rating teachers low is sometimes not worth assigning low ratings; (b) how supervisors often give higher ratings to those with perceived potential, also in support of their future growth, even if current evidence suggests a lower rating is warranted; (c) how having “difficult conversations” can sometimes prevent supervisors from assigning the scores they believe teachers may deserve, especially if things like job security are on the line; (d) supervisors’ challenges with removing teachers, including “long, laborious, legal, draining process[es];” and (e) supervisors’ challenges with replacing teachers, if terminated, given current teacher shortages and the time and effort, again, it often takes to hire (ideally more qualified) replacements.
References:
Jerald, C. D., & Van Hook, K. (2011). More than measurement: The TAP system’s lessons learned for designing better teacher evaluation systems. Santa Monica, CA: National Institute for Excellence in Teaching (NIET). Retrieved from http://files.eric.ed.gov/fulltext/ED533382.pdf
Kraft, M. A, & Gilmour, A. F. (2017). Revisiting the Widget Effect: Teacher evaluation reforms and the distribution of teacher effectiveness. Educational Researcher, 46(5) 234-249. doi:10.3102/0013189X17718797
Steinberg, M. P., & Kraft, M. A. (forthcoming). The sensitivity of teacher performance ratings to the design of teacher evaluation systems. Educational Researcher.
Weisberg, D., Sexton, S., Mulhern, J., & Keeling, D. (2009). “The Widget Effect.” Education Digest, 75(2), 31–35.
This blog post has been shared by permission from the author.
Readers wishing to comment on the content are encouraged to do so via the link to the original post.
Find the original post here:
The views expressed by the blogger are not necessarily those of NEPC.