School Finance 101: The Collapse of State School Finance Systems & Why It Matters
This post is a follow up to my recent post identifying America’s Most Financially Disadvantaged School Districts.
Let me start by summarizing the why it matters part, which I address more thoroughly here. The bottom line – a substantial body of empirical research indicates the positive influence of state school finance reforms on student outcomes. As explained in the post linked above:
To summarize, there exist no methodologically competent analyses yielding convincing evidence that significant and sustained funding increases provide no educational benefits, and a relative few which do not show decisively positive effects.[xvii] On balance, it is safe to say that a sizeable and growing body of rigorous empirical literature validates that state school finance reforms can have substantive, positive effects on student outcomes, including reductions in outcome disparities or increases in overall outcome levels.[xviii]
Several state specific longitudinal studies discussed in that post have shown positive effects on student outcomes of substantive, targeted state school finance reforms. Among the most studied states is Massachusetts, and its reforms initiated in the 1990s.
Three studies of Massachusetts school finance reforms from the 1990s find similar results. The first, by Thomas Downes and colleagues found that the combination of funding and accountability reforms “has been successful in raising the achievement of students in the previously low-spending districts.” (p. 5)[i]The second found that “increases in per-pupil spending led to significant increases in math, reading, science, and social studies test scores for 4th- and 8th-grade students.”[ii]The most recent of the three, published in 2014 in the Journal of Education Finance, found that “changes in the state education aid following the education reform resulted in significantly higher student performance.”(p. 297)[iii]
But who needs all that empirical stuff anyway? Sadly, that’s what we’ve come to.
Here, I’ll take a quick look at the formerly good, the always bad and the increasingly downright ugly in state school finance systems. But for some apparent positive movement on school finance formula reforms in Pennsylvania (which starts at the bottom of the heap), there isn’t a whole lot of good news out there. Despite the slow, steady but uneven economic recovery across states state school finance systems remain in decline or in recession-frozen state.
In our sort-of-annual report “Is School Funding Fair” we estimate “fairness ratios” for state and local revenues and for staffing (per 100 pupils). We’ve been producing that report for a few years and the newest report takes a look at the last five years of available data to show which states improved the equity (fairness) of their state school finance systems and which have gotten worse. A “fairness ratio” is a measure of “progressiveness” of the distribution of resources, where a ratio of 1.2 would indicate that a very high poverty school district has 20% more revenue, or staffing (or whatever resource) than a very low poverty school district in that same state (corrected for competitive wage variation and economies of scale).
We can now track relatively consistently, these fairness ratios for a 21 year period! This means we can really capture the ebb and flow of equity within states and we can attach to those trends, key events. For example, here’s what’s happened in New Jersey for the 21 year period, for a) state and local revenue per pupil fairness (which includes revenue for capital expenses), b) current spending per pupil fairness (which includes federal title I funds to high poverty schools) and c) teachers per 100 pupils fairness.
Figure 1. New Jersey Fairness Trends over Time
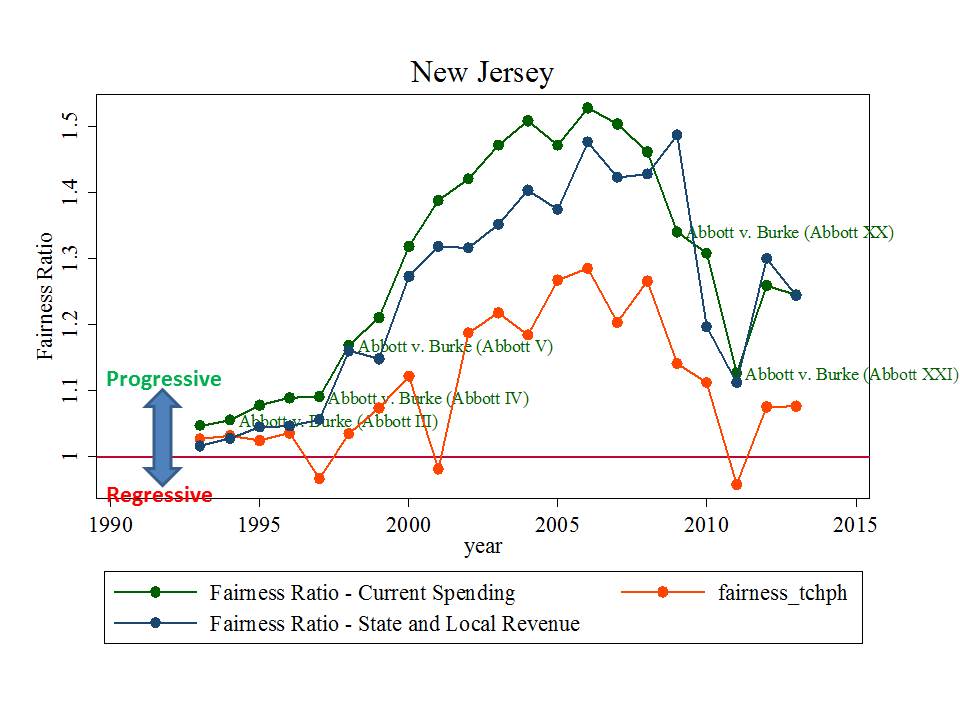
As we can see, New Jersey’s funding fairness peaked around 2005 and since then has taken a significant tumble. 2011 data appear problematic, but consistently so across each measure. Nonetheless, by 2013, New Jersey had reverted to roughly the same degree of progressiveness as had been achieved by 2000, and substantively less than in 2005.
Here’s what the pattern across districts looks like for 2013, where, for each district the poverty rate and revenue per pupil measure are expressed relative to the average for the labor market of that district.
Figure 2. Relative Poverty and Relative Revenues for New Jersey Districts in 2013
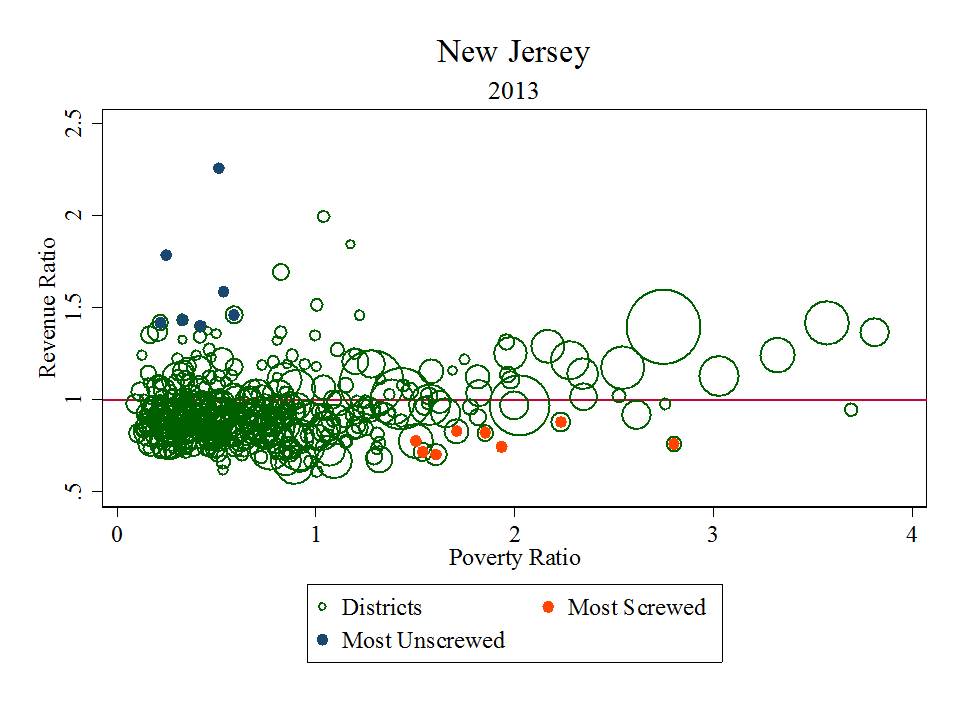
New Jersey still maintains a relatively consistent up hill, progressive slope of the relationship between revenues and poverty. However, this progressiveness is in sharp decline with frozen and reduced funding to high need districts, and low poverty districts beginning to run away from the pack, raising significantly more local tax revenue. Also, there are those high need districts that have largely been left out (orange dots).
Sadly, this is about as good as it gets these days.
Another “model” school finance system over time has been Massachusetts. But here’s the long term trend.
Figure 3. Massachusetts Fairness Trends over Time
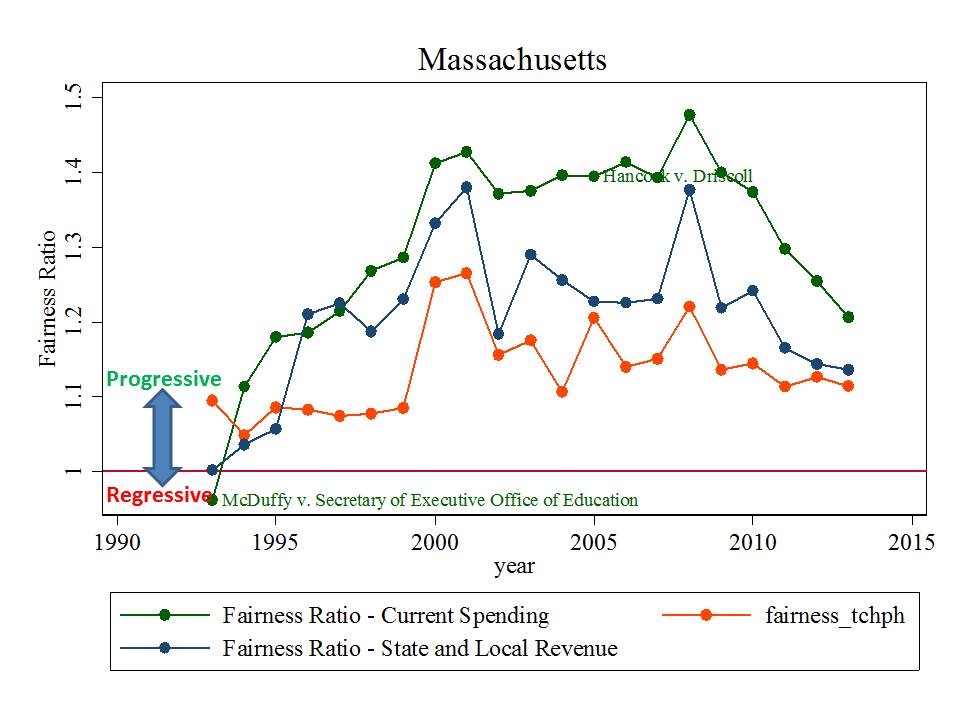
Funding fairness in Massachusetts has collapsed similarly to that of New Jersey, reverting to levels not seen since around 2000. This despite numerous studies showing the positive influence of the scale up in targeted resources. But the distribution of revenues in Massachusetts has been less consistent than that of New Jersey, and has declined even more unevenly. Figure 4 shows the 2013 pattern.
Figure 4. Relative Poverty and Relative Revenues for Massachusetts Districts in 2013
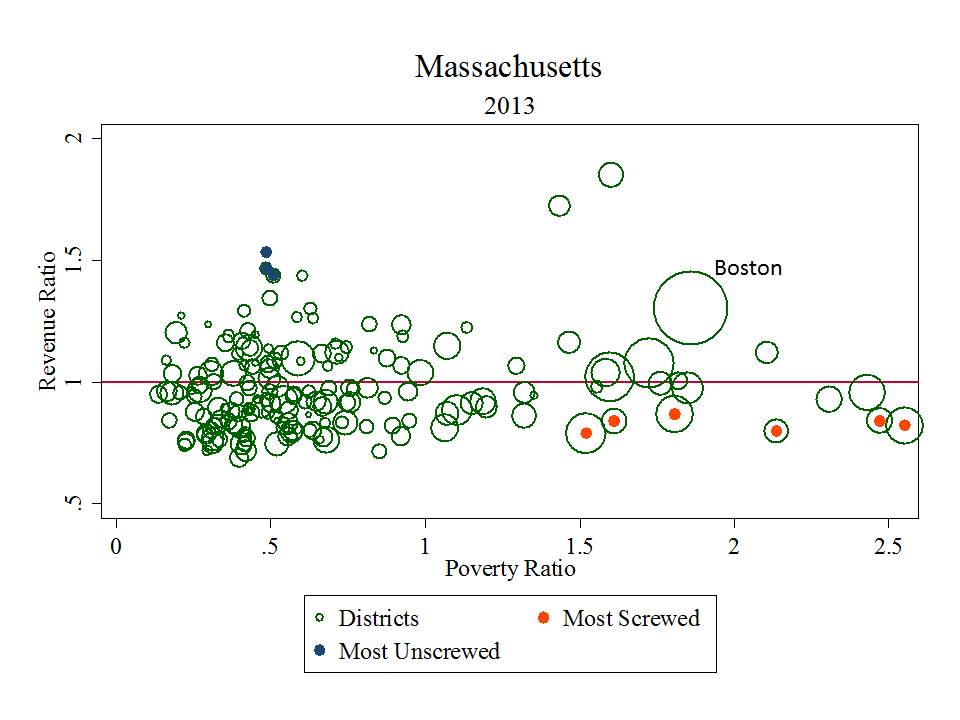
Here, the remaining progressiveness of the Massachusetts school finance system is driven almost entirely by funds targeted to the City of Boston (which, by no means, is to suggest that Boston has received adequate support given its needs, but rather, that Boston has been provided relatively more adequate support than some similarly high poverty districts). Other high need districts are left out. Massachusetts has a surprising number of relatively large enrollment districts that qualify as financially disadvantaged in my previous post (and here, by the same measures). The progressive funding behind the Massachusetts “miracle” is a thing of the past.
And again, these are the “good” states, for the most part.
Pennsylvania and Illinois are the two worst states in the nation – year after year – time and time again, when it comes to inequity of state school finance systems. Here’s Pennsylvania over time.
Figure 5. Pennsylvania Fairness Trends over Time
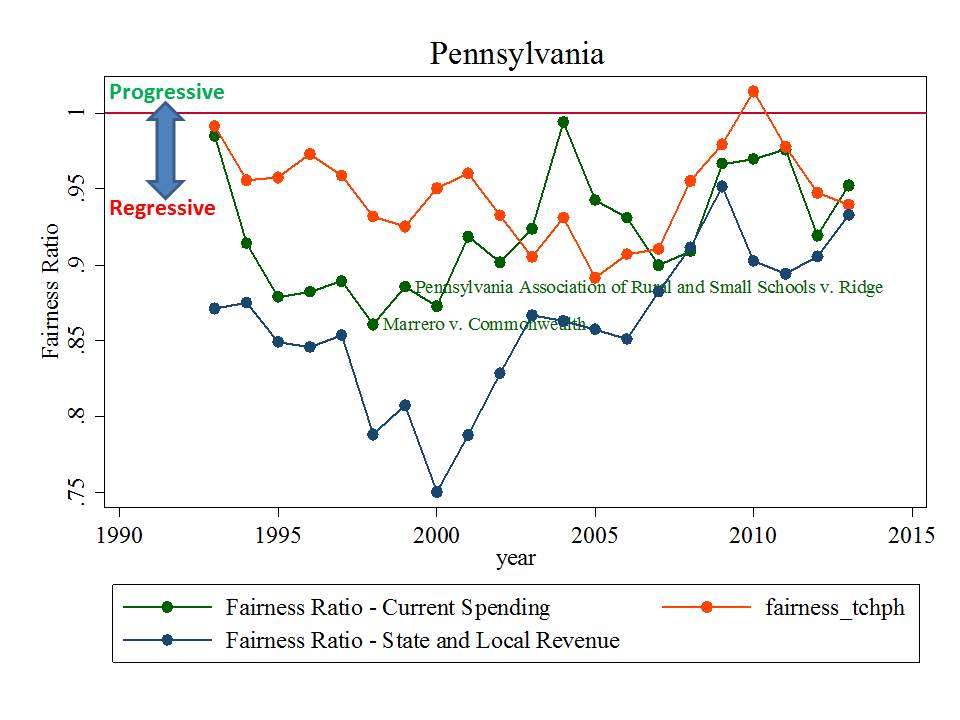
I guess the positive news here is that it’s not necessarily getting worse. Again, this stuff is relative. To an extent, the progressiveness of Pennsylvania school finance leveled off in recent years not because funding was maintained or increased in high poverty settings but because it grew more slowly in low poverty surroundings. Still, the system was, is… has pretty much always been a regressive mess. Here’s the 2013 distribution.
Figure 6. Relative Poverty and Relative Revenues for Pennsylvania Districts in 2013
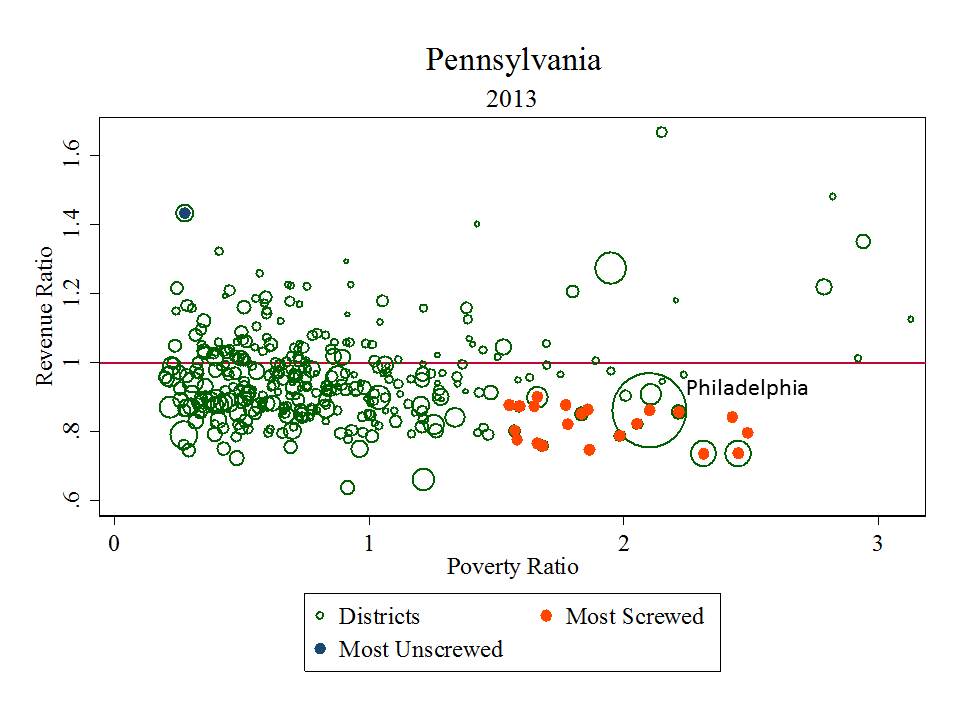
Philadelphia, Reading, Allentown and other high poverty districts mainly in eastern, PA continue to have far less revenue per pupil than their lower poverty neighbors, and districts like Lower Merion (immediately adjacent to Philly) continue to run away from the pack (blue circle district).
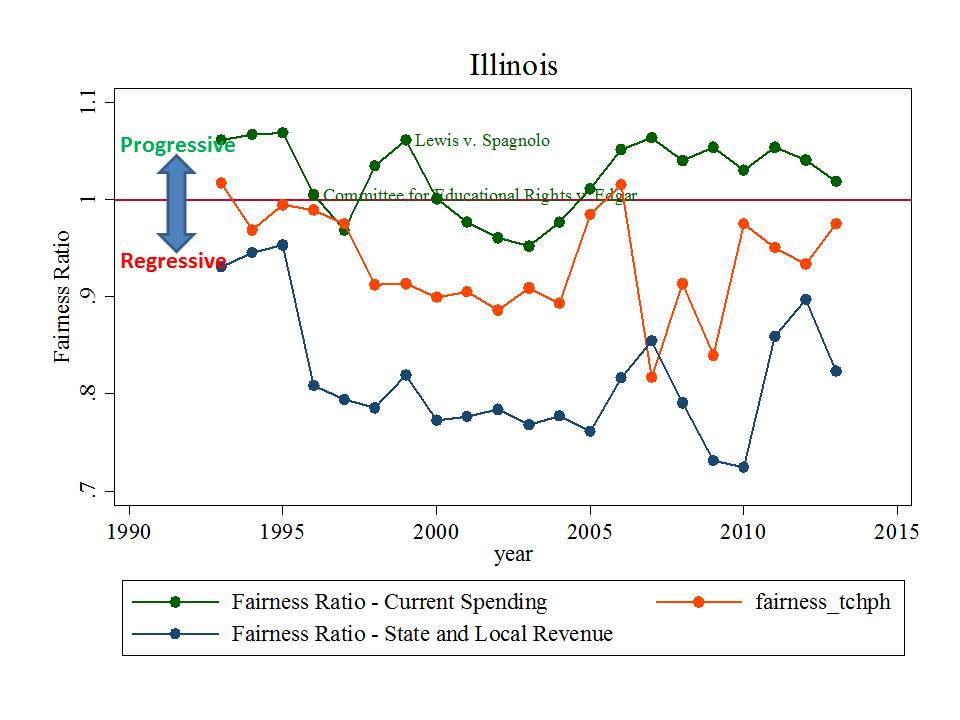
The main difference between Illinois and Pennsylvania is that Illinois has a larger number of affluent leafy suburbs that are running away from the pack. Illinois like Pennsylvania has had a consistently regressive finance system for… well… ever. Actually, it’s only gotten worse over the long term.
Figure 7. Illinois Fairness Trends over Time
And here’s the 2013 district level distribution.
Figure 8. Relative Poverty and Relative Revenues for Illinois Districts in 2013
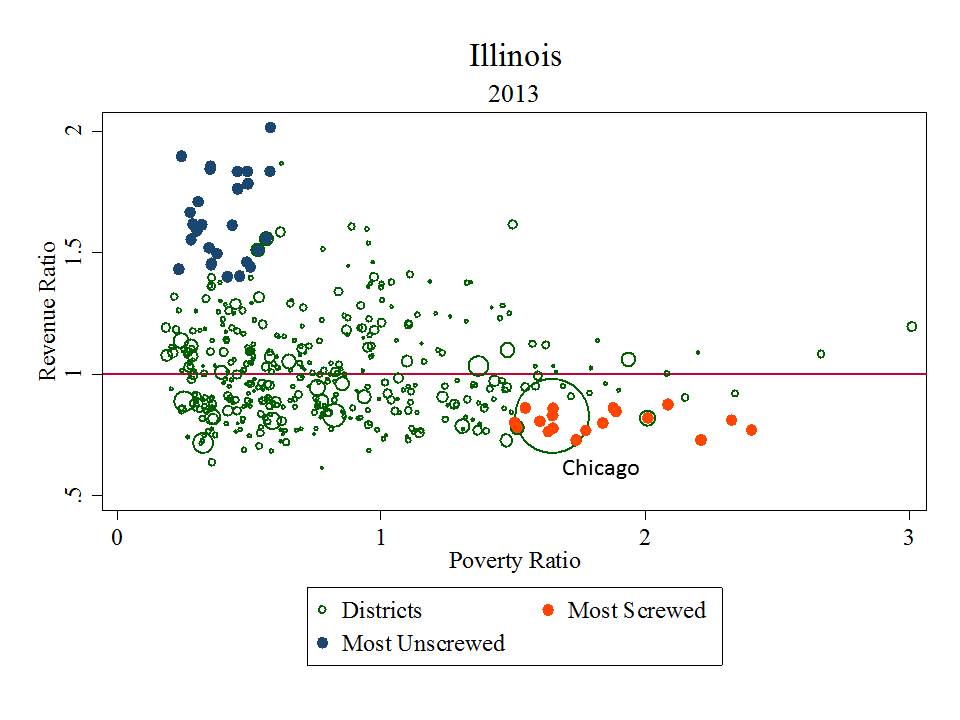
Dude… that’s just obscene. Chicago, and many of it’s high poverty, high minority concentration surroundings have far less than average revenue per pupil, which many of their low poverty neighbors have more than 50% higher than average revenue per pupil. Put bluntly, that’s just a stupid huge unfair disparity.
Here’s one more for ya’… since anti-school-funding mythology tells us that Missouri has perpetually dumped all of its money into St. Louis and Kansas City over time.
Figure 9. Missouri Fairness Trends over Time
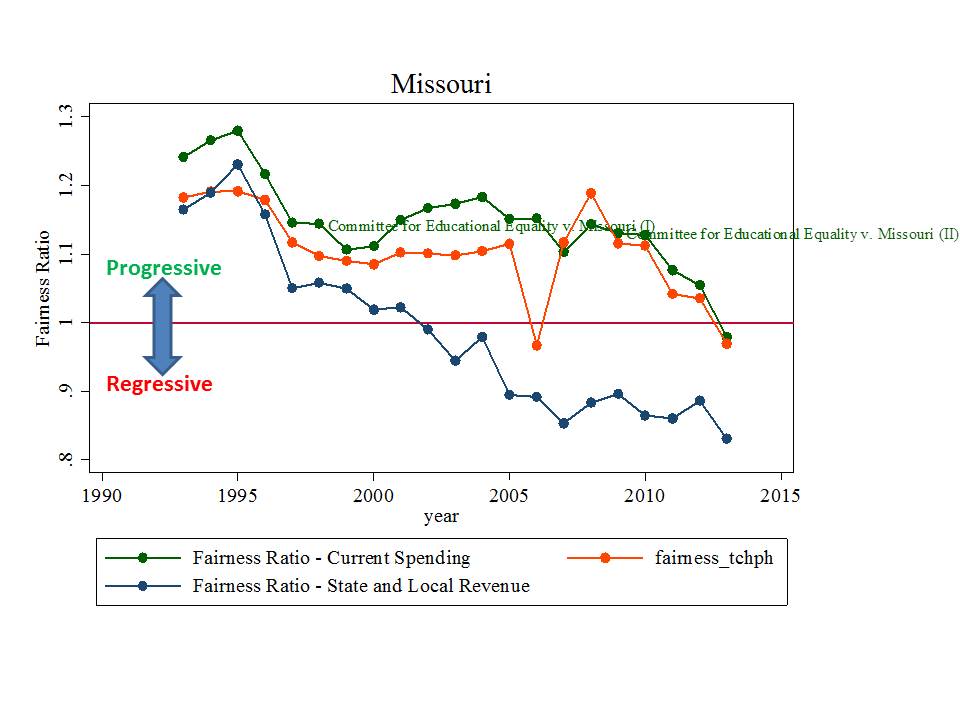
Indeed there was a period in the mid-1990s when St. Louis City and Kansas City benefited from revenues generated under desegregation orders. Notably, many of those revenues were dedicated to specific programs, services and/or capital investments. But that too is a thing of the past, and Missouri’s school finance system has been in persistent decline ever since. Here’s the 2013 distribution.
Figure 10. Relative Poverty and Relative Revenues for Missouri Districts in 2013
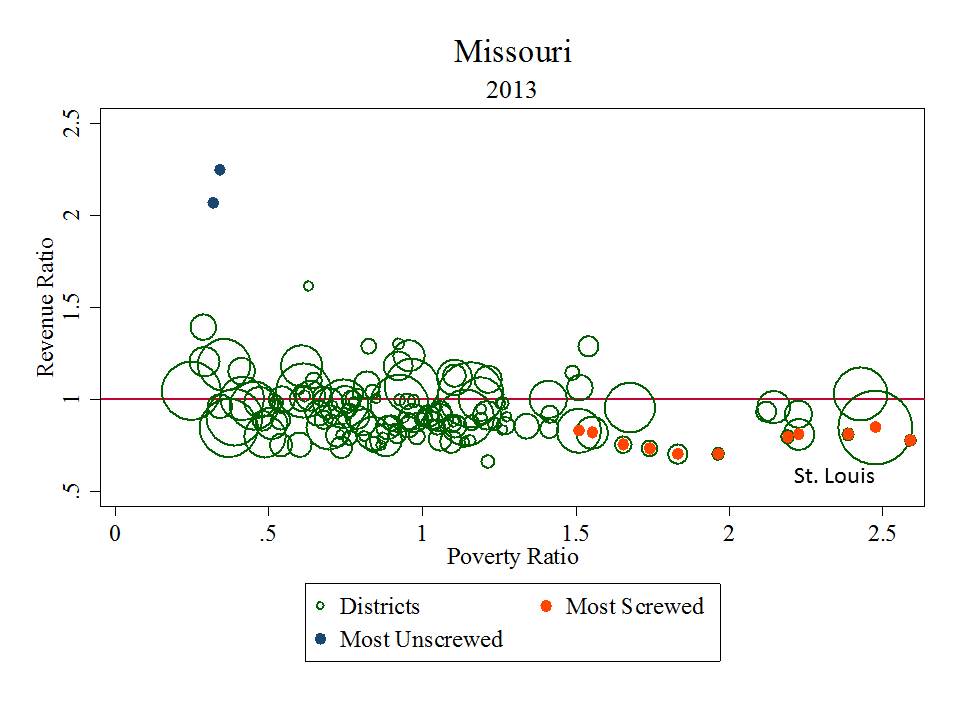
Now, even St. Louis City falls into the category of financially disadvantaged, along with many of its high poverty, high minority concentration neighbors including Riverview Gardens and Ferguson-Florissant.
We are not going to redeem our public education system – achieve “college readiness” for all and crush those common standards in a system which we choose to fund in this way.
No, charter school expansion – forcibly sorting students and dollars among inequitable choices isn’t going to put a dent in this problem. Liberty (of choice) is not a substitute for Equity! Especially when choices are constrained and inequitable.
No, firing the “bad teachers” – that is, all those whogot stuck with bad student growth ratings while being underpaid to teach in resource deprived settings with excessively large classes and total student loads... that’s not going to help either. Are there really that many totally awesome teachers waiting in line to be underpaid to do the harder work, when they can go elsewhere instead?
No, “Money-Ball” strategies won’t fix this mess, and the comparison is stupid to begin with. Yeah… fine… let baseball continue to be an “unfair game.” Kids’ schooling – education and economic opportunity shouldn’t be! It’s just that simple.
It’s time to start fixing this. Accepting the evidence that substantive, sustained and targeted school finance reforms matter. And acknowledging the simple truth that maintaining such an inequitable system serves no legitimate public, national or state interest.
Finally, it takes a robust and equitable system of taxes and revenues to solve this problem and we just need to get over that.
=====================
[i]Downes, T. A., Zabel, J., and Ansel, D. (2009). Incomplete Grade: Massachusetts Education Reform at 15. Boston, MA. MassINC.
[ii]Guryan, J. (2001). Does Money Matter? Estimates from Education Finance Reform in Massachusetts. Working Paper No. 8269. Cambridge, MA: National Bureau of Economic Research.
“The magnitudes imply a $1,000 increase in per-pupil spending leads to about a third to a half of a standard-deviation increase in average test scores. It is noted that the state aid driving the estimates is targeted to under-funded school districts, which may have atypical returns to additional expenditures.” (p. 1)
[iii]Nguyen-Hoang, P., & Yinger, J. (2014). Education Finance Reform, Local Behavior, and Student Performance in Massachusetts. Journal of Education Finance, 39(4), 297-322.
This blog post has been shared by permission from the author.
Readers wishing to comment on the content are encouraged to do so via the link to the original post.
Find the original post here:
The views expressed by the blogger are not necessarily those of NEPC.
