School Finance 101: The Cost of Stupid: Families for Excellent Schools Totally Bogus Analysis of NYC Schools
Families for Excellent Schools of New York – the Don’t Steal Possible folks – has just released an impossibly stupid analysis in which they claim that New York City is simply throwing money at failure. Spending double on failing schools what they do on totally awesome ones (if they really have any awesome ones). A link to their press release is here:
http://www.familiesforexcellentschools.org/news/press-release-cost-failure
And what is their astounding new evidence that validates that NYC is stealing possible by throwing money at failing schools? Well, they ever so carefully identified the 50 worst and 50 totally awesomest schools in the city, and then took the average of their per pupil budgets to show that the worst schools are substantially outspending the awesomest ones. Thus – money doesn’t matter- especially when in the hands of schools under the governance of their nemesis Mayor BDB and his possible-thieving lackeys.
Oh, where to even begin on this analysis. Let’s peel it all back a little, one layer at a time. Let’s begin with the fact that New York City a while back, under their favored Mayor Bloomberg, adopted something called Fair Student Funding. That formula was designed to drive systematically more money to schools serving higher need populations, including schools with higher shares of children with disabilities and higher shares of low income children. In other words, we would expect that the schools with the largest per pupil budgets in the city would be the ones serving the highest need student populations.
At the same time, we might expect that schools serving the neediest pupils might have lower average performance, even with the additional resources to leverage. The Families for Excellent Schools analysis fails to take into account any of this, using the worst possible outcome measures and failing entirely to consider differences in needs and related costs when evaluating the spending measures. Thus, they draw bold conclusions like the following:
At the middle school level, the bottom 50 schools received an average $30,256 per pupil, compared with $16,277 at the top 50 middle schools.
I happen to have a rich data set on NYC schools from 2008 to 2010, including charter schools, which has been used in this report and in a forthcoming peer reviewed article in Education Finance and Policy. The spending measure in particular is documented in detail in this report.
While these data are a few years old now, they are still useful for illustrating the utter ridiculousness of the FES analysis and for illustrating how far more appropriate analysis yields far more logical findings.
First, let’s look at how per pupil spending is distributed across NYC Middle Schools back in 2010
Figure 1 – Spending and Special Education (NYC Middle Schools 2010)
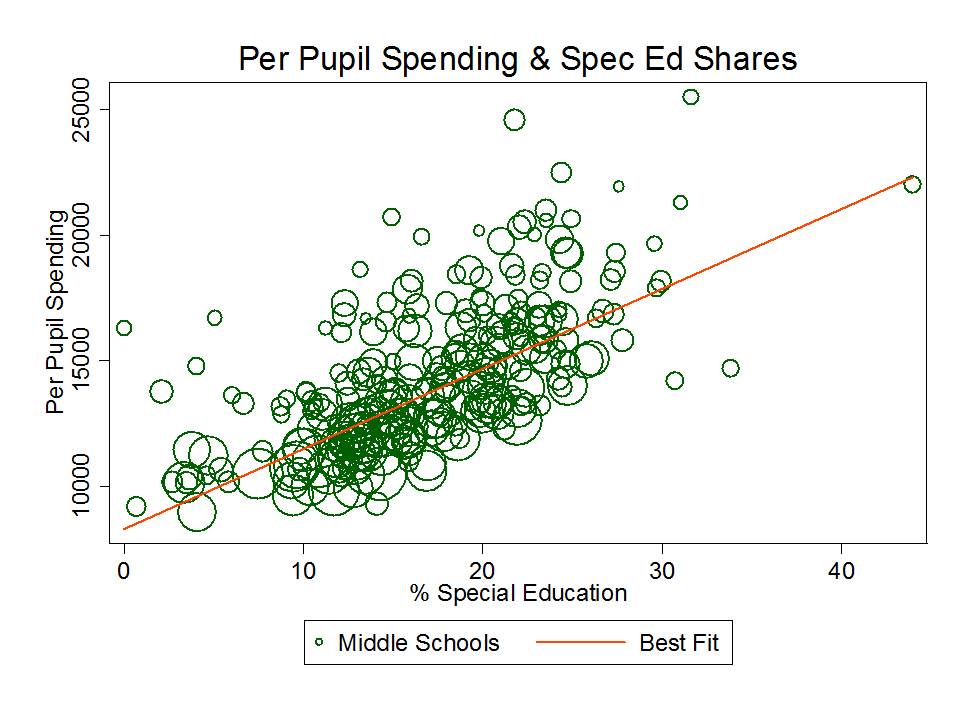
Hmmm… so schools that spend up near that $30k mark tend to have 30% or so special ed, compared to, oh, about 10% in schools spending under $15k. That might explain some of their findings (uh… or nearly all!)
Figure 2 – Spending and % Free Lunch (NYC Middle Schools 2010)
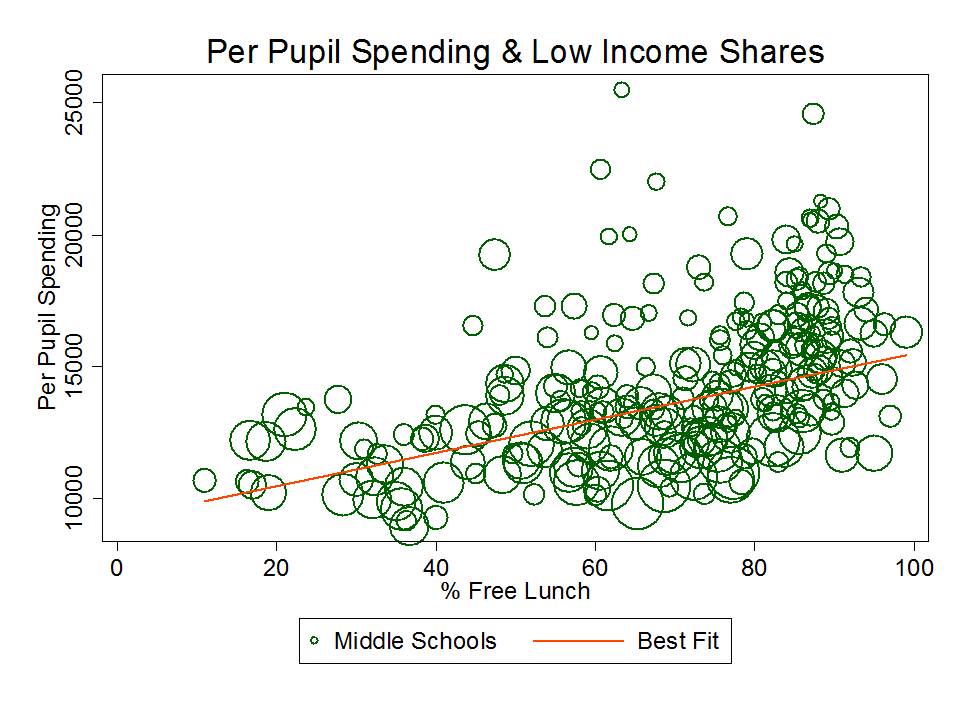
Hmm… so, schools that are low spending tend to have relatively low shares of low income children, as well as very few special education children.
Indeed, it’s true, that schools with more low income children and more children with disabilities actually have larger per pupil budgets. Reports by the City’s Independent Budget Office have found similarly, but have pointed out that the Fair Student Funding formula never really reached full implementation.
And what about unadjusted performance level measures and student outcomes? Well, as one might expect proficiency rates do tend to be lower in schools with higher rates of low income children and children with disabilities.
Figure 3 – % Special Education and Math Grade 8 Proficiency
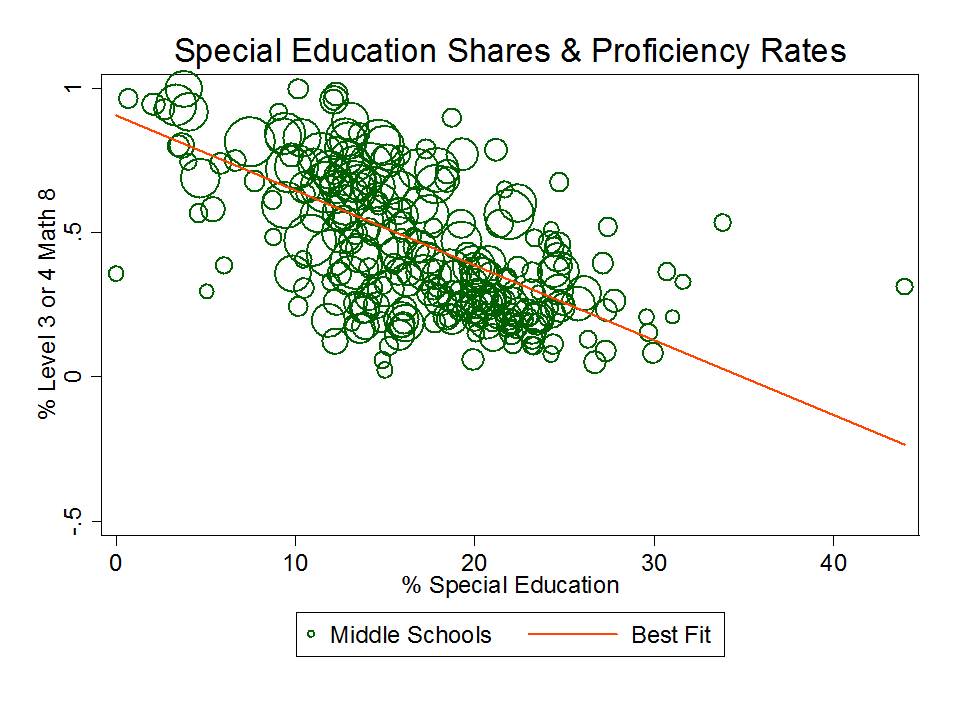
Figure 4 – % Low Income and Math Grade 8 Proficiency (NYC Middle Schools 2010)
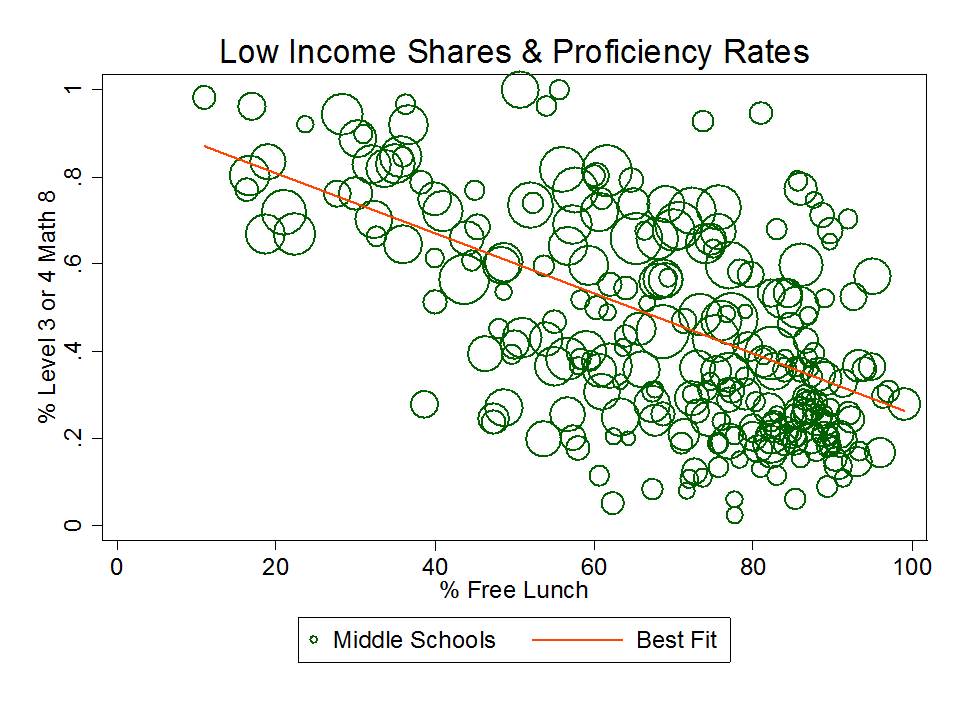
And thus, by logical extension, the higher spending schools which serve needier populations also have the lower outcomes. Which tells us freakin nothing!
So what’s the next step here? Well, first of all, what we really want to know is not what the average performance LEVEL (proficiency rate, or mean scale scores) of a school is, but whether the school is producing achievement gains for its students. So my data set also includes a measure of school value-added, constructed from the teacher value added reports released a few years back (wherein a school’s value added is the mean of its teachers’ value added). New York City’s value added model accounts (at least partly) for student characteristics, making for fairer comparisons of what schools themselves contribute to student outcomes. For example:
Figure 5 – % Special Education and School Value Added (NYC Middle Schools 2010)
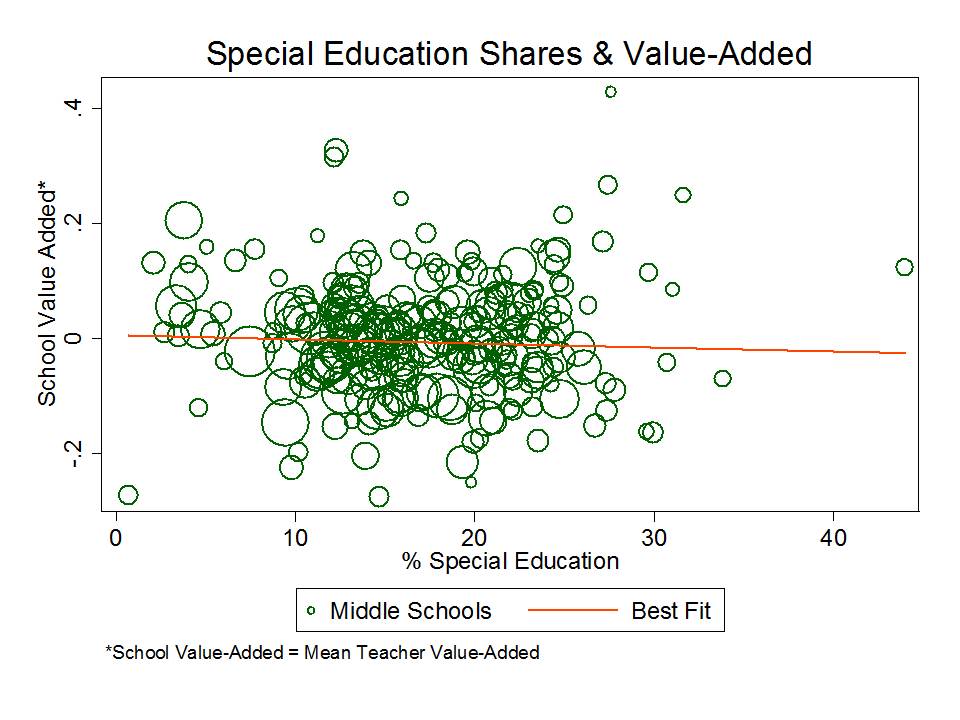
Figure 6 – % Low Income and School Value Added (NYC Middle Schools 2010)
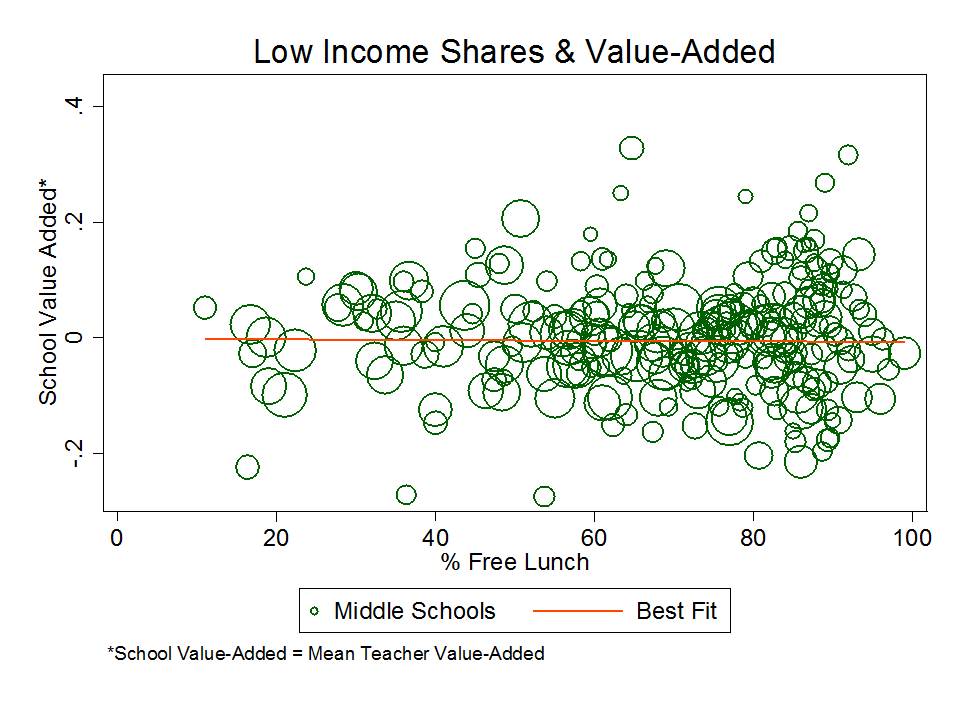
As we can see, value added outcomes of students are much less biased by the student population characteristics of the school.
But, there’s one more step we have to take here. If we really want to know whether there’s any relationship between school spending and student outcomes – or reveal the god-awful finding of FES that more spending actually harms students (when in the district schools), lowering their outcomes, making them into failures – we need to run a somewhat more complicated model to tease out that relationship.
We can run that model in either of two directions – asking:
-
Given their student populations and scale of operation, do schools with higher per pupil budgets produce higher (or lower) student achievement gains? In other words, in the current system, is higher spending associated with greater achievement gains? This is a Production Function.
Value Added Outcomes = f(Students, Scale, Spending)
-
Given the outcomes currently achieved across schools, given their student populations, what is a school expected to spend (or need to spend) to achieve those outcomes? In other words, in the current system, does it cost more to achieve higher outcomes? This is a Cost Function.
Spending = f(Value Added Outcomes, Students, Scale, Inefficiency)
So, with my approximately 260 regular middle schools per year from 2008 to 2010, I run a few models, where the goal here is simply to determine whether there really exists a massive negative relationship between spending and outcomes, as Families for Crappy Analysis would imply, or whether, in fact that relationship works in the opposite (and more likely) direction. I use a modeling approach similar to that used here.
Figure 7 – Stochastic Frontier Production Model (NYC Middle Schools 2008-2010)
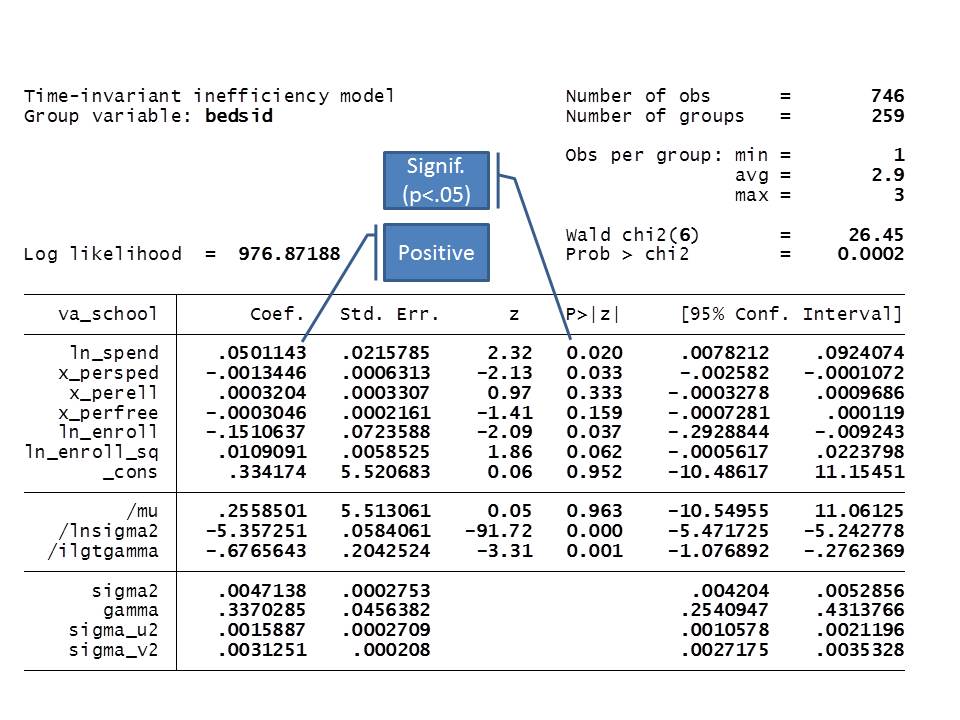
In plain language, higher spending is associated with higher value-added!
Figure 8 – Stochastic Frontier Cost Model (NYC Middle Schools 2008-2010)
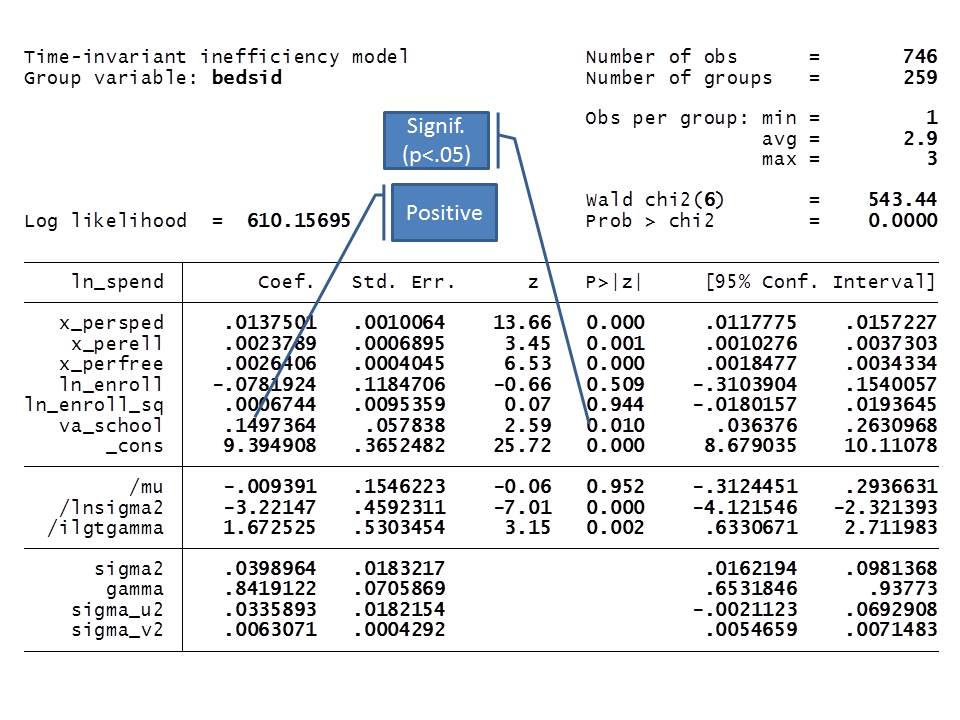
In plain language, achieving higher value added comes at a higher per pupil cost (spending, less inefficiency).
Shockingly, well, not really, I find that in each case there exists a statistically significant positive relationship between per pupil spending and the value added a school’s teachers contribute. In other words, when you do a more reasonable analysis of these data, rather than some total BS tabulation like that of Families for Agenda Driven schlock, you get a reasonable result.
Now, I have one more piece of this puzzle to add. The hacks behind this joke of an analysis propose as their policy solution, further expansion of charter schooling, shifting more resources over to charters and away from these over funded failing district schools.
Let’s look at where those charters lie when placed into the graphs above on spending and student needs.
Figure 9 – Special Education Shares and per Pupil Spending (NYC Middle Schools 2010)
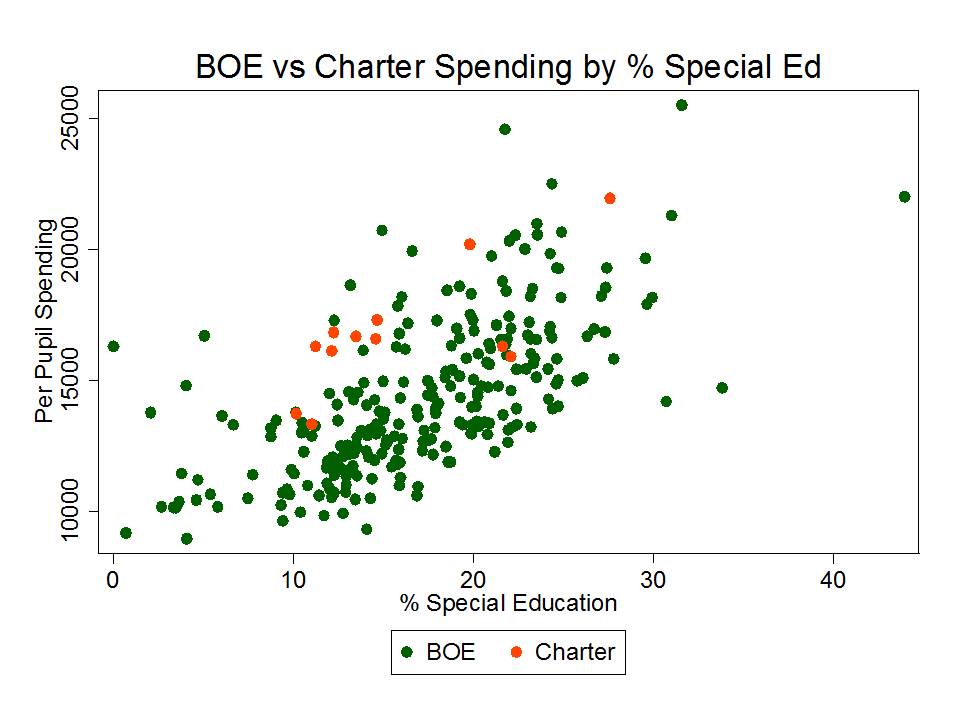
Figure 10 – Low Income Shares and per Pupil Spending (NYC Middle Schools 2010)
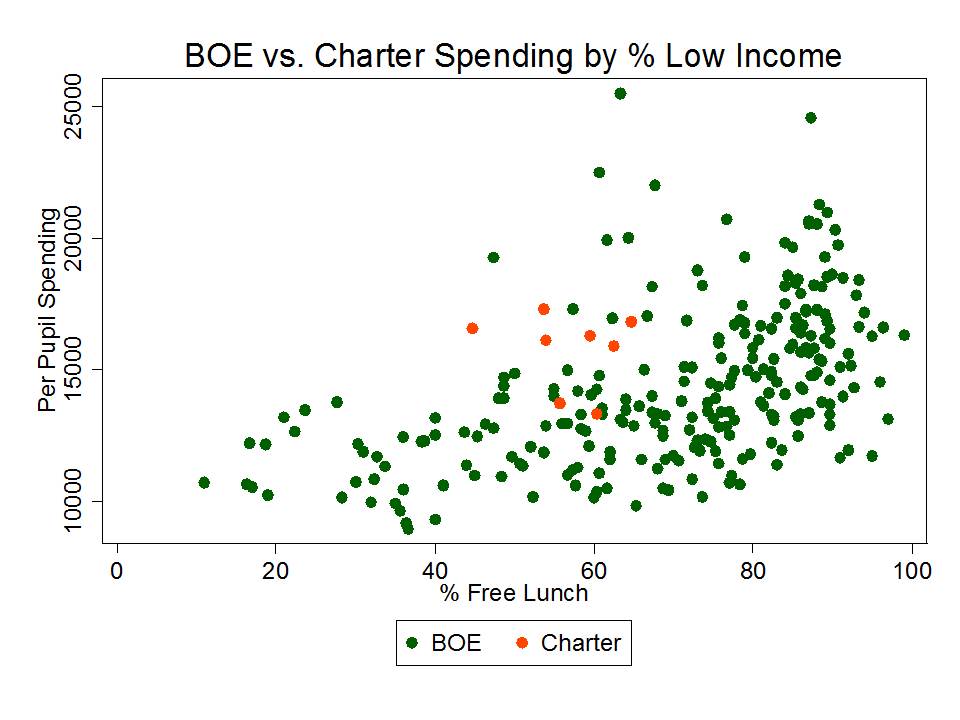
So, what they are really saying with this junk analysis is that city leaders should take money away from children with special needs in district run schools – the schools that actually serve such children – because those children aren’t “proficient” on state tests. And that money should instead be diverted to schools that serve even fewer of those children than the average district school, while already significantly outspending them. Well, that makes sense.
So the story line goes:
Money matters for us, but not for you.
Money spent on us, by us, is good.
On you, by you is bad!
Really? Really? I just can’t take this anymore.
For a more thorough summary of real research on this topic, see: http://www.shankerinstitute.org/images/doesmoneymatter_final.pdf
Note: All spending and student population measures thoroughly documented in this report.
This blog post has been shared by permission from the author.
Readers wishing to comment on the content are encouraged to do so via the link to the original post.
Find the original post here:
The views expressed by the blogger are not necessarily those of NEPC.
