School Finance 101: The Endogeneity of the Equitable Distribution of Teachers: Or, Why Do the Girls Get All the Good Teachers?
Recently, the Center for American Progress (disclosure: I have a report coming out through them soon) released a report in which they boldly concluded, based on data on teacher ratings from Massachusetts and Louisiana, that teacher quality is woefully inequitably distributed across children by the income status of those children. As evidence of these inequities, the report’s authors included a few simple graphs, like this one, showing the distribution of teachers by their performance categories:
Figure 1. CAP evidence of teacher quality inequity in Massachusetts
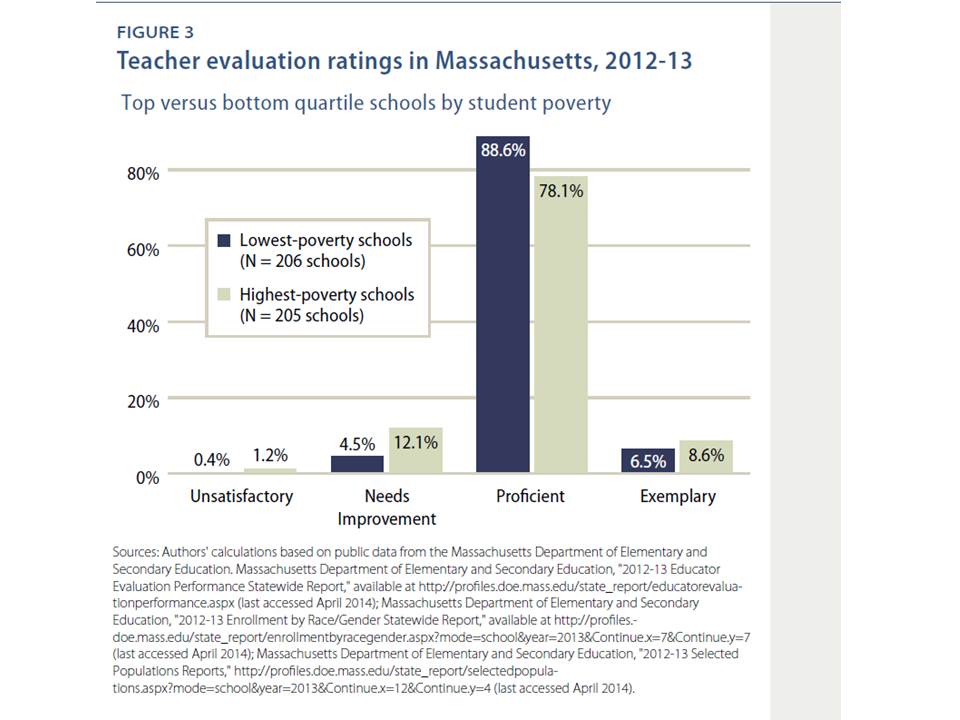
Based on this graph, the authors conclude:
In Massachusetts, the percentage of teachers rated Unsatisfactory is small overall, but students in high-poverty schools are three times more likely to be taught by one of them. The distribution of Exemplary teachers favors students in high-poverty schools, who are about 30 percent more likely to be taught by an exemplary teacher than are students in low-poverty schools. However, students in high-poverty schools are less likely to be taught by a Proficient teacher and more likely to be taught by a teacher who has received a Needs Improvement rating. (p. 4)
But, there exists (at least) one huge problem of making the assertion that teacher ratings, built significantly on measures such as Student Growth Percentiles, provide evidence of inequitable distribution of teaching quality. It is very well understood that many value added estimates in state policy and practice, and most if not all student growth percentile measures used in state policy and practice are substantially influenced by student population characteristics including income status, prior performance and even gender balance of classrooms.
Let me make this absolutely clear one more time – simply because student growth percentile measures are built on expected current scores of individual students based on prior scores does not mean, by any stretch of the statistical imagination, that SGPs “fully account for student background” and even more so, for the classroom context factors including other students and the student group in the aggregate. Further, Value Added Models (VAMs) which may take additional steps to account for these potential sources of bias are typically not successful at removing all such bias.
Figure 2 here shows the problem. As I’ve explained numerous previous times, growth percentile and value added measures contain 3 basic types of variation:
- Variation that might actually be linked to practices of the teacher in the classroom;
- Variation that is caused by other factors not fully accounted for among the students, classroom setting, school and beyond;
- Variation that is, well, complete freakin statistical noise (in many cases, generated by the persistent rescaling and stretching, cutting and compressing, then stretching again, changes in test scores over time which may be built on underlying shifts in 1 to 3 additional items answered right or wrong by 9 year olds filling in bubbles with #2 pencils).
Our interest in #1 above, but to the extent that there is predictable variation, which combines #1 and #2, we are generally unable to determine what share of the variation is #1 and what share is #2.
Figure 2. The Endogeneity of Teacher Quality Sorting and Ratings Bias
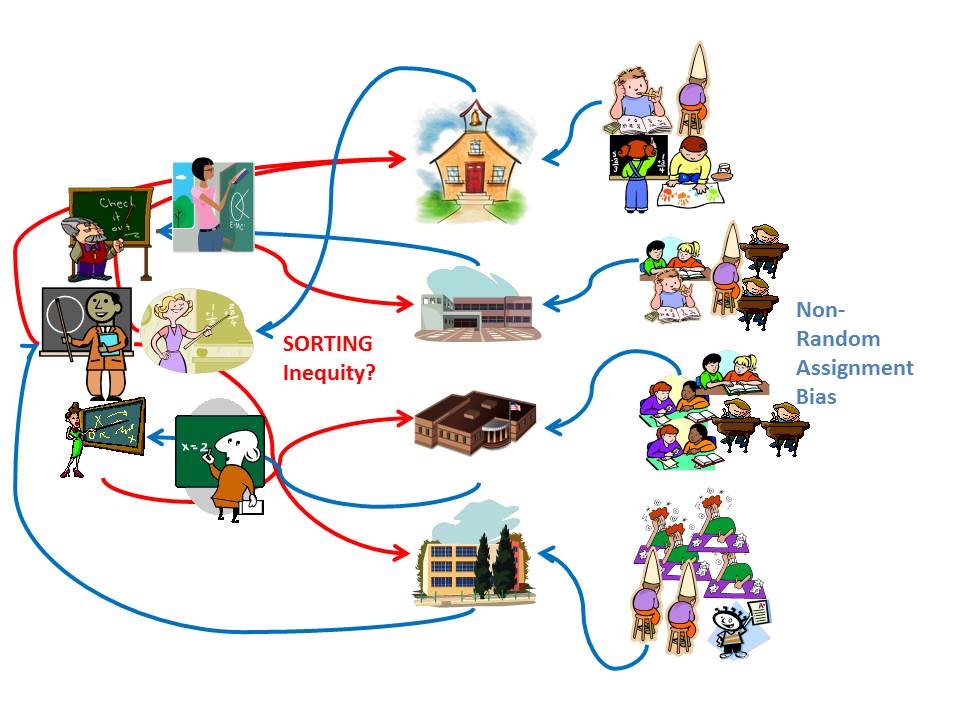
A really important point here is that many if not most models I’ve seen actually adopted by states for evaluating teachers do a particularly poor job at parsing 1 & 2. This is partly due to the prevalence of growth percentile measures in state policy.
This issue becomes particularly thorny when we try to make assertions about the equitable distribution of teaching quality. Yes, as per the figure above, teachers do sort across schools and we have much reason to believe that they sort inequitably. We have reason to believe they sort inequitably with respect to student population characteristics. The problem is that those same student population characteristics in many cases also strongly influence teacher ratings.
As such, those teacher ratings themselves aren’t very useful for evaluating the equitable distribution of teaching. In fact, in most cases it’s a pretty darn useless exercise, ESPECIALLY with the measures commonly adopted across states to characterize teacher quality.Being able to determine the inequity of teacher quality sorting requires that we can separate #1 and #2 above. That we know the extent to which the uneven distribution of students affected the teacher rating versus the extent to which teachers with higher ratings sorted into more advantaged school settings.
Now, let’s take a stroll through just how difficult it is to sort out whether the inequity CAP sees in Massachusetts teacher ratings is real, or more likely just a bad, biased ratings system.
Figure 3 relates the % of teachers in the bottom two ratings categories to the share of children qualified for free lunch, by grade level, across Massachusetts schools. As we can see, low poverty schools tend to have very few of those least effective teachers, whereas many, though not all higher poverty schools do have larger shares, consistent with the CAP findings.
Figure 3. Relating Shares of Low Rated Teachers and School Low Income Share in Massachusetts
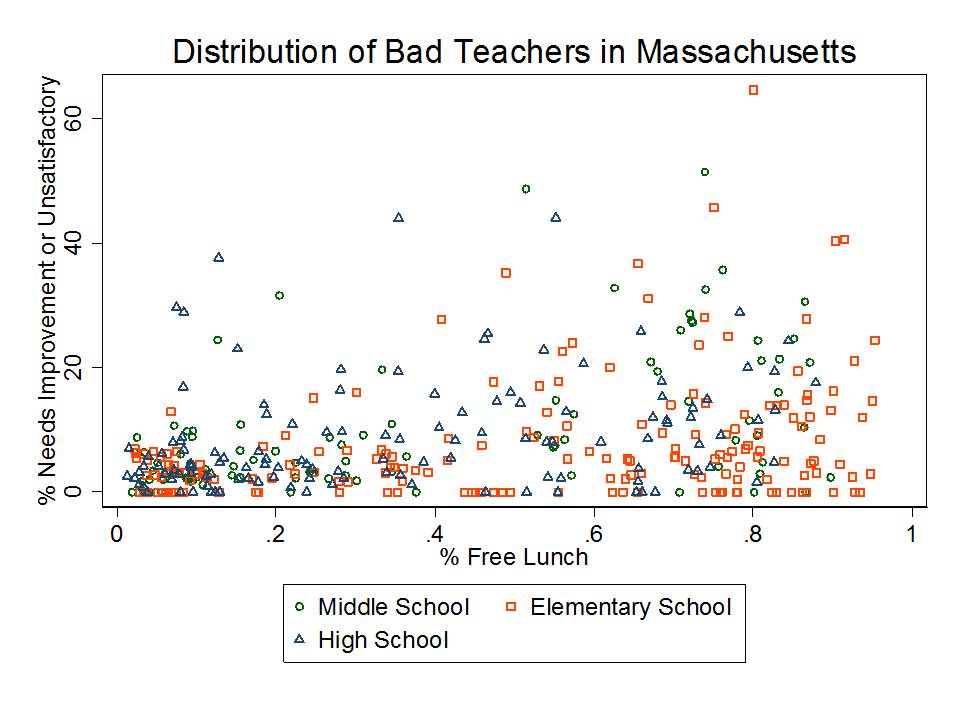
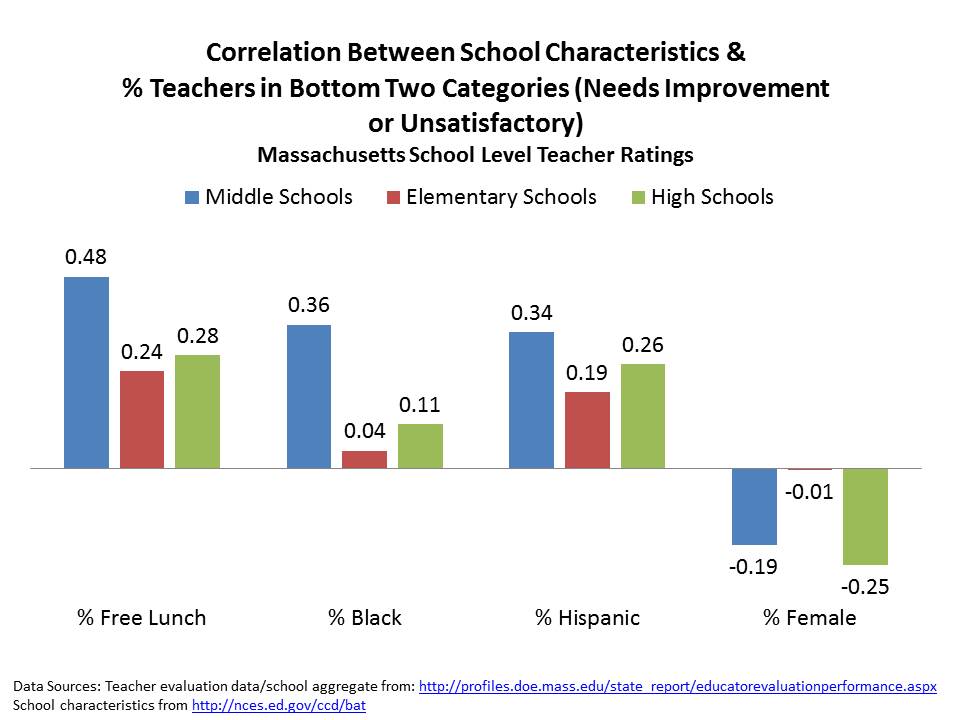
Figure 4 presents the cross school correlations between student demographic indicators and teacher ratings. Again, we see that there are more low rated teachers in higher poverty, higher minority concentration schools.
But, as a little smell-test here, I’ve also included % female students, which is often a predictor of not just student test score levels but also rates of gain. What we see here is that at the middle and secondary level, there are fewer “bad” teachers in schools that have higher proportions of female students.
Does that make sense? Is it really the case that the “good” teachers are taking the jobs in the schools with more girls?
Figure 4. Relating Shares of Low Rated Teachers and School Demographics in Massachusetts
Okay, let’s do this as a multiple regression model, and for visual clarity, graph the coefficients in Figure 5. Here, I’ve regressed the % low performing teachers on each of the demographic measures. In find a negative (though only sig. at p<.10) effect on the % female measure. That is, schools with more girls have fewer “bad” teachers. Yes, schools with more low income kids seem to have more “bad” teachers, but in my view, the whole darn thing is suspect.
Figure 5. Regression Based Estimates of Teacher Rating Variation by Demography in Massachusetts

So, the Massachusetts ratings seem hardly useful for sorting out bias versus actual quality and thus determining which kids are being subjected to better or worse teachers.
But what about other states? Well, I’ve written much about the ridiculous levels of bias in the New Jersey Growth Percentile measures. But, here they are again.
Figure 6. New Jersey School Growth Percentiles by Low Income Concentration and Grade 3 Mean Scale Scores
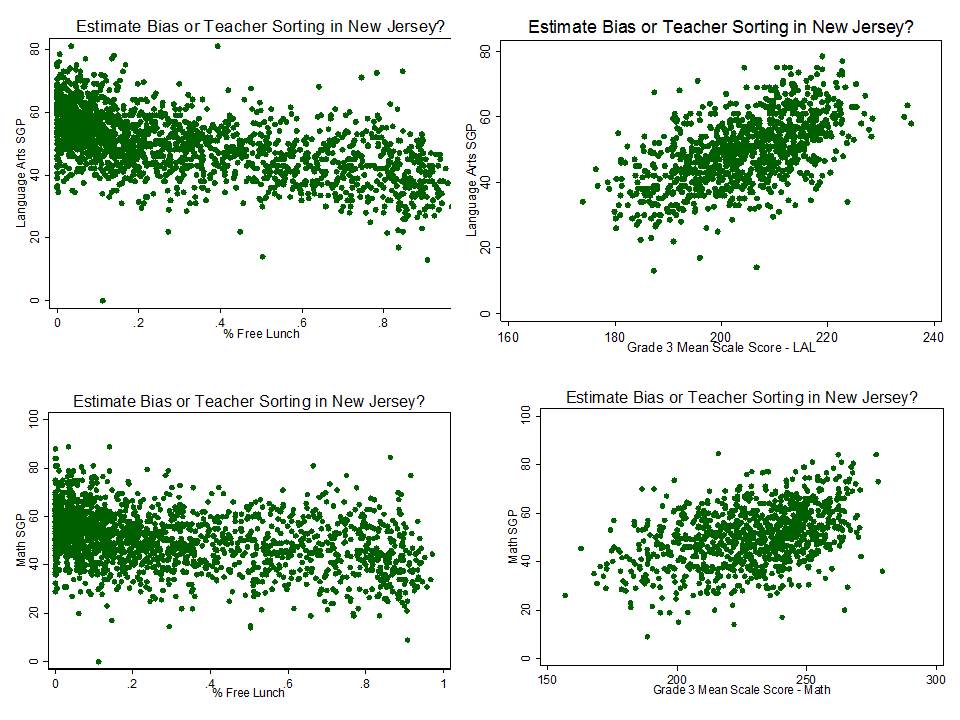
Figure 6 shows that New Jersey school median growth percentiles are associated with both low income concentration and average scale scores of the first tested grade level. The official mantra of the state department of education is that these patterns obviously reflect that low income, low performing children are simply getting the bad teachers. But that, like the CAP finding above, is an absurd stretch given the complete lack of evidence as to what share of these measures, if any, can actually be associated with teacher effect and what share is driven by context and students.
So, let’s throw in that percent female effect just for fun. Table 1 provides estimates from a few alternative regression models of the school level SGP data. As with the Massachusetts ratings, the regressions show that the share of student population that is female is positively associated with school level median growth percentile, and quite consistently and strongly so.
Now, extending CAP’s logic to these findings, we must now assume that the girls get the best teachers! Or at least that schools with more girls are getting the better teachers. It could not possibly have anything to do with classrooms and schools having more girls being, for whatever reason, more likely to generate test score gains, even with the same teachers? But then again, this is all circular.
Table 1. Regressions of New Jersey School Level Growth Percentiles on Student Characteristics
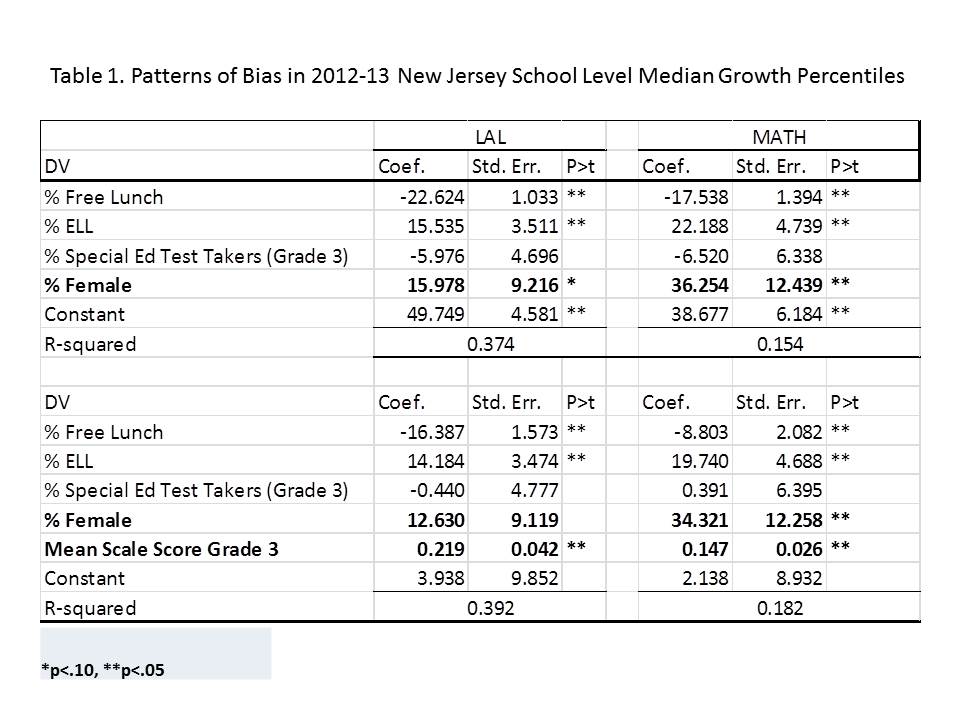
Note here that these models are explaining in the case of LAL, nearly 40% of the variation in growth percentiles. That’s one heck of a lot of potential bias. Well, either that, or teacher sorting in NJ is particularly inequitable. But knowing what’s what here is impossible. My bet is on some pretty severe bias.
Now for one final shot, with a slightly different twist. New York City uses a much richer value-added model which accounts much more fully for student characteristics. The model also accounts for some classroom and school characteristics. But the New York City model, which also produces much noisier estimates as a result (the more you parse the bias, the more you’re left with noise), doesn’t seem to fully capture some other potential contributors to value added gains. The regressions in Table 2 below summarize resource measures that predict variation in school aggregated teacher value added estimates for NYC middle schools.
Table 2. How resource variation across MIDDLE schools influences aggregate teacher value-added in NYC

Schools with smaller classes or higher per pupil budgets have higher average teacher value added! It’s also the case that schools with higher average scale scores have higher average teacher value added. That poses a potential bias problem. Student characteristics must be evaluated in light of the inclusion of the average scale score measure.
Indeed, more rigorous analyses can be done to sort the extent that “better” (higher test score gain producing) teachers migrate to more advantaged schools, but with very limited samples of data on teachers having prior ratings in one setting who then sort to another (and maintain some stable component of their prior rating). Evaluating in large scale, without tracking individual moves, even when trying to include a richer set of background variables is likely to mislead.
Another alternative is to reconcile teacher sorting by outcome measures with teacher sorting by other characteristics that are exogenous (not trapped in this cycle of cause and effect). Dan Goldhaber and colleagues provide one recent example applied to data on teachers in Washington State. Goldhaber and colleagues compared the distribution of a) novice teachers, b) teachers with low VAM estimates and c) teachers by their own test scores on a certification exam, across classrooms, schools and districts by 1) minority concentration, 2) low income concentration and 3) prior performance. That is, the reconciled the distribution of their potentially endogenous measure (VAM) with two exogenous measures (teacher attributes). And they did find disparities.
Notably, in contrast with much of the bluster about teacher quality distribution being primarily a function of corrupt, rigid contract driving within district and within school assignment of teachers, Goldhaber and colleagues found the between district distribution of teacher measures to be most consistently disparate:
For example, the teacher quality gap for FRL students appears to be driven equally by teacher sorting across districts and teacher sorting across schools within a district. On the other hand, the teacher quality gap for URM (underrepresented minority) students appears to be driven primarily by teacher sorting across districts; i.e., URM students are much more likely to attend a district with a high percentage of novice teachers than non-URM students. In none of the three cases do we see evidence that student sorting across classrooms within schools contributes significantly to the teacher quality gap.
These findings, of course, raise issues regarding the logic that district contractual policies are the primary driver of teacher quality inequity (the BIG equity problem, that is). Separately, while the FRL results are not entirely consistent with the URM (Underrepresented Minority) findings, this may be due to the use of a constant income threshold for comparing districts in rural Eastern Washington to districts in the Seattle metro. Perhaps more on this at a later point.
Policy implications of misinformed conclusions from bad measures
The implications of ratings bias vary substantially by the policy preferences supported to resolve the supposed inequitable distribution of teaching. One policy preference is the “fire the bad teachers” preference, assuming that a whole bunch of better teachers will line up to take their jobs. If we impose this policy alternative using such severely biased measures as the Massachusetts or New Jersey measures, we will likely find ourselves disproportionately firing and detenuring, year after year, teachers in the same high need schools, having little or nothing to do with the quality of the teachers themselves. As each new batch of teachers enters these schools, and subsequently faces the same fate due to the bogus, biased measures it seems highly unlikely that high quality candidates will continue to line up. This is a disaster in the making. Further, applying the “fire the bad teachers” approach in the presence of such systematically biased measures is likely a very costly option – both in terms of the district costs of recruiting and training new batches of teachers year after year, and the costs of litigation associated with dismissing their predecessors based on junk measures of their effectiveness.
Alternatively, if one provides compensation incentives to draw teachers into “lower performing” schools, and perhaps take efforts to improve working conditions (facilities, class size, total instructional load), fewer negative consequences – even in the presence of bad, biased measurement, are likely to occur. One can hope, based on recent studies of transfer incentive policies, that some truly “better” teachers would be more likely to opt to work in schools serving high need populations, even where their own rating might be at greater risk (assuming policy does not assign high stakes to that rating). This latter approach certainly seems more reasonable, more likely to do good, and at the very least far less likely to do serious harm.
This blog post has been shared by permission from the author.
Readers wishing to comment on the content are encouraged to do so via the link to the original post.
Find the original post here:
The views expressed by the blogger are not necessarily those of NEPC.
