School Finance 101: Graph of the Day: My Contribution to PISA Palooza
With today’s release of PISA data it is once again time for wild punditry, mass condemnation of U.S. public schools and a renewed sense of urgency to ram through ill-conceived, destructive policies that will make our school system even more different from those breaking the curve on PISA.
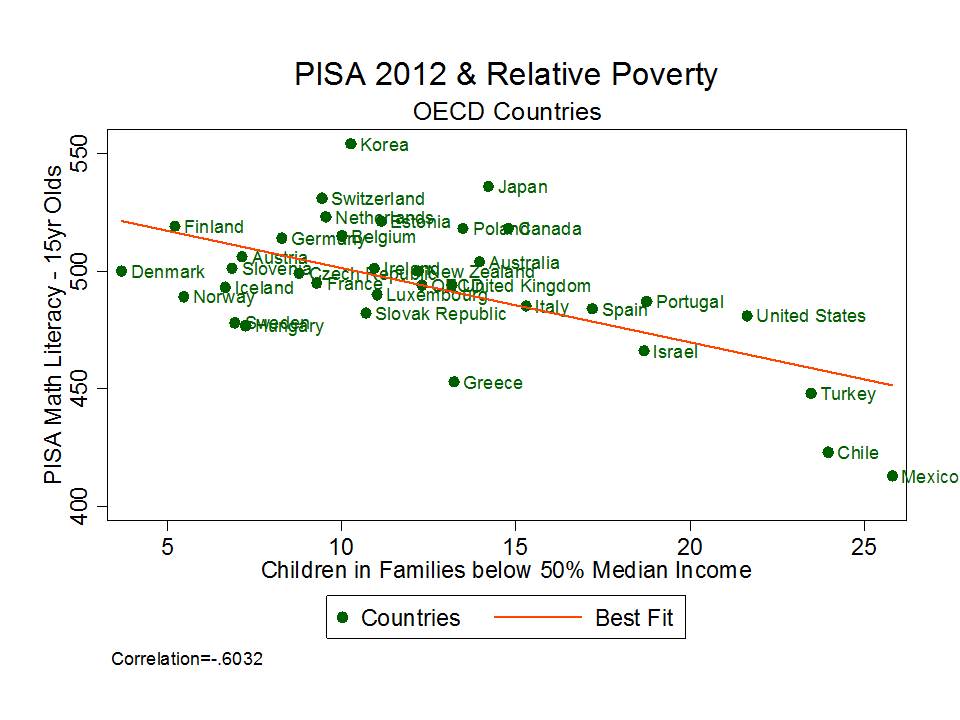
With that out of the way, here’s my little graphic contribution to what has become affectionately known to edu-pundit class as PISA-Palooza. Yep… it’s the ol’ poverty as an excuse graph – well, really it’s just the ol’ poverty in the aggregate just so happens to be pretty strongly associated with test scores in the aggregate – graph… but that’s nowhere near as catchy.
PISA Data: http://nces.ed.gov/pubs2014/2014024_tables.pdf
(table M4)
OECD Relative Poverty: Source: Provisional data from OECD Income distribution and poverty database (www.oecd.org/els/social/inequality).
Yep – that’s right… relative poverty – or the share of children in families below 50% of median income – is reasonably strongly associated with Math Literacy PISA scores. And this isn’t even a particularly good measure of actual economic deprivation. Rather, it’s the measure commonly used by OECD and readily available. Nonetheless, at the national aggregate, it serves as a pretty strong correlate of national average performance on PISA.
What our little graph tells us – albeit not really that meaningful – is that if we account (albeit poorly) for child poverty, the U.S. is actually beating the odds. Way to go? (but for that really high poverty rate).
Bottom line – economic conditions matter and simple rankings of countries by their PISA scores aren’t particularly insightful (and the above graph only marginally more insightful). Further, comparisons of cities in China to entire nations is a particularly silly approach.
Additional Readings:
Coley, R., Baker, B.D. (2013) Poverty and Education: Finding the Way Forward. ETS Center for Research on Human Capital and Education. Princeton, NJ: Educational Testing Service
http://www.ets.org/s/research/pdf/poverty_and_education_report.pdf
Baker, B.D., Welner, K.G. (2011) Productivity Research, the U.S. Department of Education, and High‐Quality Evidence. Boulder, CO: National Education Policy Center. Retrieved [date] from http://nepc.colorado.edu/publication/productivity‐research
This blog post has been shared by permission from the author.
Readers wishing to comment on the content are encouraged to do so via the link to the original post.
Find the original post here:
The views expressed by the blogger are not necessarily those of NEPC.
