How Modern School Finance/Education Policy Works: Lessons from New York
I’ll admit that the more I do this stuff, the more I write about today’s education policy environment and especially the environment around school funding, I do get more cynical. And few states have done more to encourage my cynicism than New York, of late. But I suspect that the tales from the trenches in many other states might be quite similar. So let me use New York as a prototype of the twists and turns and warped logic of modern state education policy. New York education policy has followed a four step process:
Step 1: Slither out from court order by rigging low-ball foundation aid formula
As I noted on another recent post, several years back the New York Court of Appeals ordered that the state legislature provide sufficient funding (specifically to New York City) to achieve a “sound basic education” which was ultimately equated with a “meaningful high school education.” The city and governor’s office presented to the court alternative estimates of what that would cost. The state (governor/legislature/regents), as might be expected sought a “less expensive” option. And the court largely took their side. That is, the court ordered that the system be fixed, but largely (uncritically, but for some dissenting minority opinion) accepted the state’s proposal to fix it.
The state achieved their low-ball estimate by pulling a few classic tricks, some of which have been used in other states. First, the state based their minimum funding level on average spending of existing districts meeting the state standards – but had set a relatively low bar for those standards (a bar most were already surpassing anyway). Then they chose to look only at the “instructional” spending share of current spending (lopping off a large chunk of spending that’s actually needed to operate a school). Rhode Island recently pulled the same garbage, but instead of looking at instructional spending for districts within Rhode Island they used instructional spending in the neighboring states of Massachusetts, Connecticut and New Hampshire (okay… NH doesn’t border RI… does it… but don’t tell their Commissioner… ‘cuz including NH allowed them to bring the average down! See link above).
The final step in their low-ball analysis was to look only at the average spending of the lower half spending districts that meet the state standards – assuming those districts to be the “efficient” ones, better reflecting minimum “costs.” Of course, what this does in New York State is to eliminate from the calculation nearly every district in the Rockland, Westchester, NYC and Long Island regions. So… base level of funding is essentially the average instruction-only spending of the lower half spending districts that have at least somewhat below current average outcomes, and lie somewhere between Syracuse and Buffalo. That makes sense right? That should give us a reasonable ballpark cost for New York City, Mount Vernon or Yonkers, right?
Even for my 2012-13 analyses below, the foundation level per pupil is set to only $6,570, where it is assumed that the average instructional spending per pupil needed in a New York State to achieve state standards. So then, how does that stack up against alternative cost estimates of what would actually be needed to achieve specific state outcome targets?
I don’t have time to explain the chart below in great detail, but I do provide complete analysis/explanation in this report on New York State school finance.
In short, what Figure 1 shows us is in PURPLE, the foundation level, or target funding calculated to be needed by districts in each poverty quintile under the state’s own proposed remedy to their constitutional violation. The PURPLE is the amount of money a district would have under the foundation aid formula, as a combination of state aid and levying the minimum required local effort.
The blue bars come from a cost model produced a few years back by William Duncombe of Syracuse University in which he used that model to estimate the average spending actually required to achieve a 90% proficiency rate on state assessments (where the average had drifted over time, making the 80% standard relatively meaningless – again, see report). The red arrows show the gap between estimated costs of reasonable outcome goals and guaranteed funding under the foundation formula.
Figure 1:
 The point here is simply to show a) how much the state low-balled the target funding using their approach vs. a more rigorous approach, and b) how those funding gaps increase quite dramatically for higher poverty districts. In fact, the target funding level is not that far off for low poverty districts, but it’s only slightly better than half of the cost of comparable outcomes for high poverty districts.
Step 2: Conjure annual excuses for why the state can’t afford to fund even its own low-balled targets for local districts
Given figure 1 above, it might be bad enough if the state did follow through and fund its formula. The formula itself was/is grossly insufficient, determined by bogus calculations and filtrations (exclusions) of data all toward the end goal of generating the lowest possible politically palatable estimate of the cost of providing a sound basic education in New York.
But no… no… low-balling the cost wasn’t nearly far enough for the NY legislature and Gov(ernors) to go. The next step was to say – We can’t afford it (they were saying this even before the economy tanked, and they set out a multiyear phase in)! We can’t afford our own low-ball estimate (while decrying that the estimate was somehow actually overly generous?).
Did they cut back just a little from their target? Oh… say… give districts about 90% or 80% (uh… that would actually be a lot of cut) of what the formula said they needed? Nope. They went much deeper than that. In fact, as I showed in one recent post, as student population needs escalate (according to the state’s own Pupil Need Index) under-funding with respect to foundation targets grows in some cases to over $4,000 per pupil and in New York City to over $3,000 per pupil.
Figure 2.
 As I showed in that same post, among the most screwed large districts in the state, several receive from the state in general foundation aid only about half (or less) of what they should receive under the STATE’S OWN LOW-BALL FORMULA!
Figure 3.
 Let’s be clear here. I’m not talking about shortfalls from the relatively high cost targets in that first graph. I’m talking about state aid shortfalls relative to the STATE’S OWN LOW-BALL Foundation Aid model – the model represented by the purple bars in the first graph. Note also that the state in proposing this foundation model that they’ve subsequently underfunded, essentially declared that low-ball model to be the empirical manifestation of their own state constitutional obligation. It’s their own freakin’ definition of their constitutional obligation…. And they’ve chosen to ignore it.
Step 3: Pretend that it’s all the teachers’ fault and use that as a basis for holding hostage additional funding that should have gone to high need districts years ago!
Oh… but it doesn’t end there!
Riding the national, Duncanian wave of new normalcy (which I’ve come to learn is an extreme form of innumeracy) & reformyness, the only possible cause of lagging achievement in New York State is bad teachers –greedy overpaid teachers with fat pensions – and protectionist unions who won’t let us fire them. Clearly, the lagging state of performance in low income and minority districts in New York State has absolutely nothing at all to do with lack of financial resources under the low-balled aid formula that the state has chosen to not even half fund for the past 5 years? Nah… that couldn’t have anything to do with it. Besides, money certainly has nothing to do with providing decent working conditions and pay which might leveraged to recruit and retain teachers.
And we all know that if New York State’s average per pupil spending is high, or so the Gov proclaims, then spending clearly must be high enough in each and every-one of the state’s high need districts! (right… because averages always represent what everyone has and needs, right? Reformy innumeracy rears its ugly head again!).
So it absolutely has to be the fact that no teacher in NY has ever been evaluated at all, or fired for being bad even though we know for sure that at least half of them stink. The obvious solution is that they must be evaluated by egregiously flawed metrics – and we must ram those metrics down their throats.
In fact, the New York legislature and Governor even found it appropriate to hold hostage additional state aid if districts don’t adopt teacher evaluation plans compliant with the state’s own warped demands and ill-conceived policy framework.
As I understand it, legislation passed this past year actually tied receipt of state general aid to compliance with the state teacher evaluation mandate. That, in order to receive any increase in state general/foundation aid over prior year, a districts would have to file and have accepted their teacher evaluation plan.
That’s it – we’ll take away their general state aid – their foundation aid – the aid they are supposed to be getting in order to comply with that court order of several years back. The aid they are constitutionally guaranteed under that order. I’m having some trouble accepting the supposed constitutional authority of a state legislature and governor to cut back general aid on this basis – where they’ve already failed to provide most of the aid they themselves identified as constitutionally adequate under court order?But I guess that’s for the New York Court system to decide.
If nothing else, it is thoroughly obnoxious, arbitrary and capricious and grossly inequitable treatment. I hear the reformers (who understand neither math nor school finance) whine… But why… why is it inequitable to require similarly that poor and rich districts follow state teacher and principal evaluation guidelines. Setting aside thejunk nature of that evaluation system and the bogus measures on which it rests (and the fact that the reformers’ fav-fab-charters have largely rightfully ignored the eval mandate), it is inequitable because districts serving higher poverty children stand to lose more money per child as a result of non-compliance. And they’ve already been squeezed.
And here’s how that plays out. As I understand it, if districts don’t comply by January, they face the threat of losing the small increase in state aid they received for the current year (compared to 11-12). So, they’d lose it retro-actively, part way through this year. And guess what? Because higher need districts received a marginally greater increase in state aid, they’d lose more per pupil. But the gaps shown above actually already include that oh-so-generous increase! That’s right, the poorer you are, the bigger the financial penalty for non-compliance with the teacher evaluation mandate – and the bigger the financial hole the state has put you in to begin with!
Figure 4. State aid Per Pupil Before and After Non-Compliance Penalty by Student Need
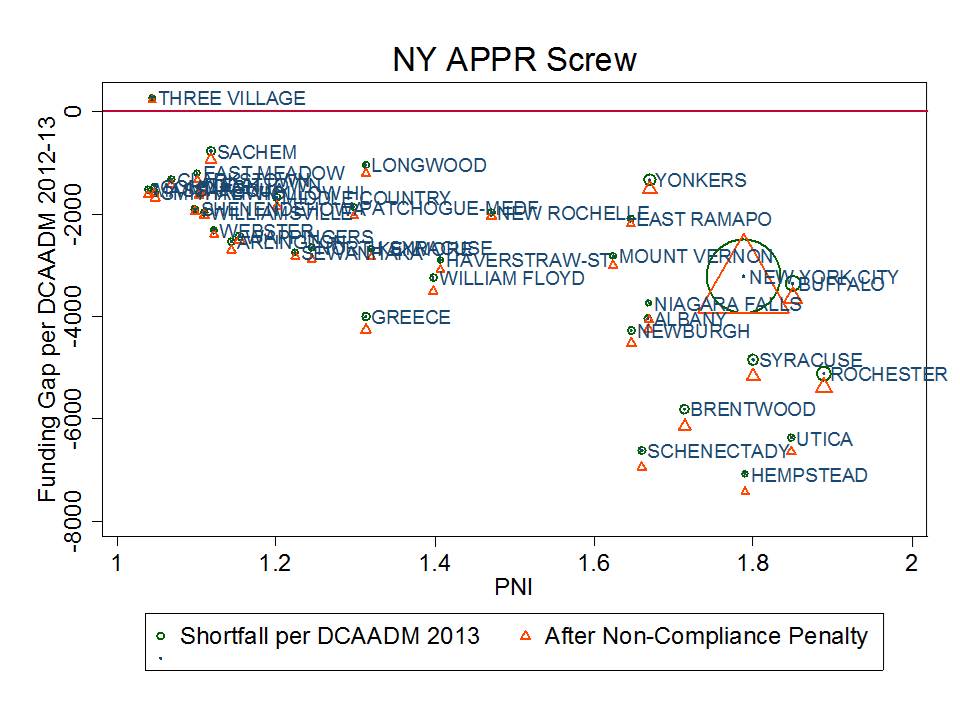 Figure 5. Compliance Penalty by Student Need

This recent article explains that Hempstead, already underfunded by the largest per pupil amount of any large district in the state, stands to lose another $3.5 million in aid if it does not come to agreement on a teacher evaluation plan. State general aid is for the general provision of education to these kids – to pay for enough teachers, classrooms etc. It’s about the day to day operations of schools to ensure the provision of a sound basic education. This funding shouldn’t be held hostage over reformy whims.
Note that for many districts I have likely understated the amount of aid they would lose because I have counted only changes to general, foundation aid, including “gap elimination adjustment” and partial restoration of those funds. (it would appear, for example, that the potential losses to Hempstead reported in the news are closer to that districts total aid change, not just foundation/GEA change).
Step 4: Protect billions in state aid still being allocated to districts with far fewer additional student needs/costs
And let us not forget that New York State was one of the shining stars – a poster child – of my report with Sean Corcoran for the Center for American Progress where we chronicled how states actually use their aid systems to make equity worse, not better. While the NY Gov and Legislature have continued to shed elephant tears (in purely political terms) about their fiscal dire straits, the state persists in protecting billions in state direct aid and indirect tax relief subsidies that largely support the states lower and lowest need local public school districts.
Figure 6 shows that if we look at state general aid, based on initial calculations to local districts by poverty (left hand panel), even after allocating state general aid, there remains an $1,100 per pupil gap in state and local revenue between high and lower poverty districts. But, after the state “tweaks” the state general aid distribution to provide minimum aid to the wealthiest districts and increase aid to middle/upper middle class districts, and then adds on “tax relief” subsidies, the gap between higher and lower poverty districts increases to $2,300 per pupil. Yep – NY state is actually using billions in state funding to make the system less equitable! Read the report below for more thorough explanation/analysis!
Figure 6. School Finance Pork in New York!

And that is how modern state education policy works!
This blog post has been shared by permission from the author.
Readers wishing to comment on the content are encouraged to do so via the link to the original post.
Find the original post here:
The views expressed by the blogger are not necessarily those of NEPC.
