School Finance 101: Relinquishing Efficiency: NOLA Data Snapshots
There’s always plenty of bluster about the post-Katrina NOLA miracle. I’ve done a few posts on the topic, but none recently.
See:
The NOLA model of “relinquishment” continues to be pitched as a handy-dandy reformy solution for dismantling the dysfunctional urban school district and achieving miraculous gains in overall student outcomes (like those reported by CREDO), of course, at little or no increased expense. Indeed this latter piece is merely implied, by the complete and utter silence on the question of just how much money is being thrown at this alternative model in order to prove it “works.”
The purpose of this post is merely to put some of this NOLA bluster into context, using readily available data sources, including the NCES Common Core Public School Universe and NCES Fiscal Survey of Local Governments, along with CRDC/Ed Facts data released for states to conduct equity analyses to support their “teaching equity” plans.
First off, here are the pre, to post Katrina enrollment patterns for district and charter schools identified as within city boundaries of New Orleans:

City enrollments remain far lower than they were pre-Katrina, and any comparisons of the present, to that era, or even to the immediate post-Katrina era, when nearly all students remained displaced, are not useful. Most students are now in Charter schools, meaning that establishing a “counterfactual” comparison of charter students against “non-charter” students, as in the typical charter pissing match studies, is, well, rather difficult if not implausible.
As one might expect, once you’ve got most kids in charter schools, then the charters must somewhat mirror the population that had been in district schools, and remain in the few non-charters as of the final year of these data.

Really, no surprises here. Of course, we might find a different story if I had readily available data on children with disabilities, by the severity of those disabilities.
This next graph shows the per pupil current spending over time.

Now, that spike in 2006 is NOT because all of the sudden NOLA schools spent a whole lot more, but rather because the denominator – Pupils – nearly disappeared. Per pupil spending goes up when pupils decline, if spending does not decline commensurately.
It’s a simple math thing. But, even after the system stabilized at its new level, the state of Louisiana has seen fit to boost spending for the Recovery School District to 55% higher than state average spending. Prior to Katrina, NOLA schools were merely at parity with state averages. That’s a substantive boost. And one I’m certainly not complaining about, given the needs of these children. But certainly any claims of NOLA miracles, if they do exist, must include conversation about the “massive infusion of funding” in relative terms associated with this “relinquishment” experiment.
This increase (relative to surroundings) is greater than the boost received by Newark, NJ at any point during school funding litigation in NJ.
And where has some of that money gone? Well, this graph shows transportation expenditures per pupil over time.

While a bit volatile from year to year, the NOLA experiment seems to be leading to at least DOUBLE state average (non-rural) transportation spending per pupil – AND this is occurring in the most population dense part of the state, where one would expect average transportation costs to be lower. To put these figures into context, taking the margin of difference in transportation spending as about $600 per pupil in the most recent year, that figure is about 6% over the state average $10k per pupil operational expense (that is, consuming the first 6% of the 55% elevated spending on RSD, for a non-transportation RSD margin of 49%, still a healthy boost).
But what had been going on at ground level – within the “district” across schools – when there still existed district and charter schools? Here are some snapshots of total staffing expenditures per pupil by school organized first by low income concentration and then by special education.
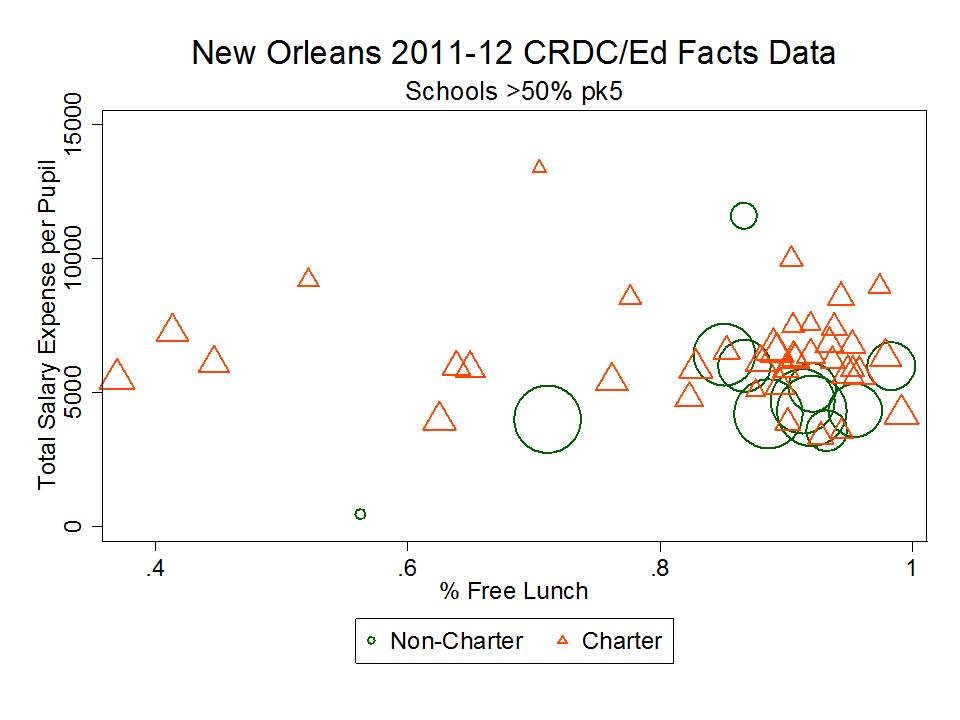

Visually, it would certainly appear that the edge was being given to charter schools in terms of resources. In which case, any policy inferences based on assertions that charter schools yielded better outcomes, should certainly consider the influence of the additional resources. To clarify, the following table shows the output of a regression comparing the per pupil staffing expenditure across charter, and “other” schools in New Orleans, for schools serving similar shares of low income children, children with disabilities and serving similar grade range distributions.

On average, the CRDC/Ed Facts data indicate that Charter Schools in New Orleans were spending $1,604 per pupil more than were “other” schools serving similar student populations. And that’s a hefty boost given that spending ranged from about $4,000 to $8,000 for most districts. That’s 40% of the $4,000 figure.
Again, any interpretation of differential effectiveness of charters versus other schools in New Orleans should consider the potential relevance of a 40% differential in staffing expenditure per pupil.
Setting aside theHUGE ACCOUNTABILITY concerns associated with this model (which no-one should ever set aside), and significant concerns over thelegal rights of children and taxpayers (again, which should never be set aside), there are some potential lessons for pundits and policymakers here. If there is even a success story to be told in NOLA (which I’m unconvinced), that success isn’t free, and it isn’t cheap.
So many pundits over time have ridiculed as the most inefficient experiment in social engineering of all time, the Kansas City desegregation plan of the 1990s. Now, there’s much misguided bluster – urban legend – in those characterizations, as I’ve written in the past. Perhaps one of my greatest fears about the NOLA experiment is that it will provide more fodder for the assertion that money doesn’t matter. Heck, they’ve thrown a lot of money at this so far. They’re just not talking about it. It’s being spent on exorbitant transportation costs, among other things.
Strangely, for now, all I hear is silence from the anti-spending, efficiency warriors of the ed policy world when it comes to NOLA. Does that mean that money really matters (accepting the NOLA miracle characterization), or, alternatively, is NOLA proving (by not substantively improving outcomes with a 55% boost in funding) that the inefficiencies of a 100% charter/choice/unified enrollment system are equal to or greater than those of the urban school district of the past?
This blog post has been shared by permission from the author.
Readers wishing to comment on the content are encouraged to do so via the link to the original post.
Find the original post here:
The views expressed by the blogger are not necessarily those of NEPC.
