Shanker Blog: School District Fragmentation, Segregation, and Funding Equity in New Jersey
District fragmentation is a very important but sometimes overlooked factor shaping school segregation, school funding equity, and the relationship between them. Put simply, fragmentation refers to the fact that, in some states, there are hundreds of small districts, while other states are divided into a smaller number of large districts. For example, at the extremes, there are 67 (countywide) districts serving Florida’s 3 million public school students, whereas New Jersey maintains around 600 districts for its 1.3 million students.
School district boundaries have been drawn and redrawn over time, and they’re still changing today (Diem et al. 2015; Frankenburg and Taylor 2017; EdBuild 2019; Taylor et al. 2019). But these borders aren’t just lines on a map. In many respects, they represent a spatial structure of educational access and opportunity. During the early 1970s, U.S. Supreme Court decisions made district boundaries effectively impervious to desegregation orders (Milliken v. Bradley), while allowing the unequal school funding generated by inter-district differences in local property tax revenue (San Antonio ISD v. Rodriguez). Protected by district boundaries, affluent families have considerable control over access to their schools and the resources that fund those schools.
In this post, we take a look at these issues using data from New Jersey, focusing on segregation and funding inequity by student race and ethnicity (though we’d reach the same basic conclusions were we to focus on income/poverty). More specifically, we estimate, for illustrative purposes, what would happen to racial/ethnic gaps in K-12 funding adequacy if New Jersey consolidated all of its regular public school districts into their home counties, creating 21 large countywide districts instead of 600 small districts.
Here’s a quick summary of our findings:
- Total racial/ethnic school segregation in New Jersey is overwhelmingly between rather than within school districts, and most of that between-district segregation is within counties;
- If we hypothetically consolidated all the state’s districts into their home counties, this would reduce racial/ethnic gaps in school funding adequacy by 75-80 percent;
- The reduction is primarily due to the sharing of costs between districts serving vastly different student populations than their counterparts in the same counties.
We conclude with a couple of implications of this illustration, most notably the fact that, in New Jersey and elsewhere, strategic consolidation of school district boundaries, and/or policies allowing inter-district tax-sharing, can potentially go a long way toward improving the adequacy and equity of K-12 funding.
Why does district fragmentation matter?
There are various theories pertaining to how people are sorted into school districts and other political jurisdictions (Tiebout 1956; Danielson 1976; Weiher 1991; Charles 2003; Krysan and Crowder 2017), and fragmentation is not without its potential benefits. For example, smaller districts can promote community cohesion, greater political partcipation, and better “matching” between public services and residents’ preferences for those services. In fact, communities of color have historically established broad political power and greater civic capacity through local control of school level politics (Henig et al. 1999; Morel 2017).
That said, while the causal direction of the relationship almost certainly goes both ways, more fragmentation is generally associated with greater school segregation (Alesina et al. 2004; Bischoff 2008; Frankenburg 2009; Ayscue and Orfield 2014; Richards and Stroub 2014), particularly segregation between school districts, which is now the dominant form in metropolitan areas (Reardon et al. 2000; Stroub and Richards 2013).
The within-/between-district distinction is important in our context because the school district is the primary organizational unit in school finance. Within-district differences in funding and/or funding adequacy are typically dwarfed by between-district disparities. When fragmentation contributes to between-district segregation, the latter can in turn exacerabate school funding inequality (Sosina and Weathers 2019; Weathers and Sosina 2022). It also, as we’ll see, reduces the degree to which education costs are shared. So let’s take a quick look at the school segregation situation in New Jersey.
The structure of school segregation in New Jersey
New Jersey’s public school student population is quite diverse: among elementary schools, for example, approximately 44 percent of students are white, 17 percent are Black, and 33 percent are Hispanic (we’ll be focusing on these three racial/ethnic groups, and excluding all others from our analysis, but the remaining 14 percent of the state’s elementary school students, most of them classified as “Asian,” fall into a different group).
The state's schools, however, are far less diverse. Statewide, for example, the typical white student attends an elementary school in which over 70 percent of her peers are also white.1 Accordingly, using common evenness indexes, school segregation across the entire state of New Jersey reaches levels that are conventionally interpreted as quite high.2 But we are more interested in breaking down this total segregation into its constituent “parts.” This simple decomposition (using the information theory segregation index) is presented in Figure 1.3
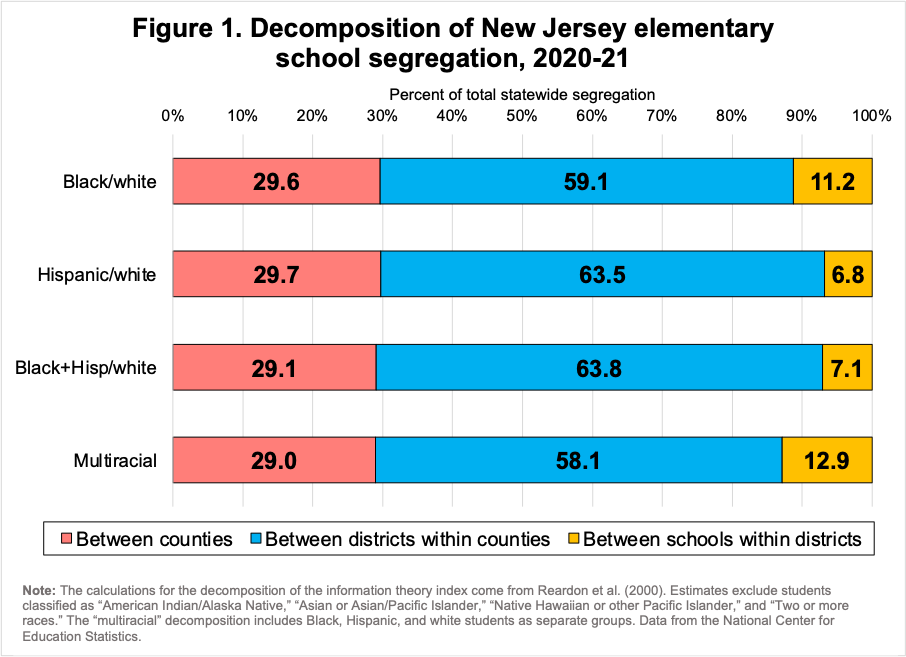
The proportions vary depending on the racial/ethnic comparison, but approximately 90-95 percent of total New Jersey school segregation is due to the separation of students across district boundaries. That is, segregation between counties (the red portions of the bars) and segregation between districts within counties (the blue portions) are the two components of total between-district segregation (since segregation between counties is also between districts), and in Figure 1 they add up to 87-93 percent, depending on the racial/ethnic comparison. The remaining 7-13 percent is attributable to the separation of students between schools within the same districts.
Put differently, if we magically desegregated elementary school students within every single one of New Jersey’s hundreds of school districts, but we could not move students between districts, this would leave 90-95 percent of total school segregation intact. Moreover, most of that 90-95 percent is between districts within counties.
Let’s be very clear: this most certainly does not mean that within-district segregation is somehow futile. It is extremely important and beneficial (e.g., Johnson 2019). Remember that the 5-10 percent estimate is the contribution of the within-district component to total segregation across the entire state. There are many school districts in New Jersey that are heavily segregated internally. They can and should be desegregated.
The point, rather, is that New Jersey exhibits rather extreme levels of between-district segregation, and much of that is due to racial/ethnic differences between districts within relatively close proximity of each other (within counties). We cannot estimate the degree to which New Jersey’s fragmented districts are responsible for this (and, again, causality goes both ways), but we can carry out a thought experiment in which the state’s current district structure is compared with an alternative scenario: countywide districts.
An illustrative consolidation of New Jersey school districts
Our next task is to compare racial/ethnic gaps in educational opportunity under New Jersey’s current district structure with a “simulated” scenario in which we consolidate all of the state’s districts into their 21 home counties.
We define equal educational opportunity as a situation in which all districts (and thus all students) receive equally adequate funding, which we define as the funding they need to achieve common student outcome goals. The latter—how much districts need—represents cost, and accounting for costs is crucial. Some students need more funding than others to achieve the same outcomes—i.e., they have higher costs (Duncombe and Yinger 2005). To the degree these students are concentrated (i.e., segregated) in certain districts, as we’ve seen is the case in New Jersey, those districts will need a lot more funding. If funding is not commensurate with need/costs, then the segregation of students will generate gaps in funding adequacy between rich and poor districts, and between white students and students of color. Our hypothetical consolidation of all New Jersey districts into their home counties can reduce these segregation-fueled gaps by “pooling” (in a sense, integrating) both funding (how much is spent) and costs (how much is needed) between a more diverse group of students.
Ideally, we would want to simulate this consolidation such that school districts (or some other disaggregate jurisdictions) within the same counties shared local (mostly property tax) revenue, but with allocation based on capacity (wealth) and costs/need. We are looking into the possibility of doing so in a future report, but for various reasons this procedure is complicated, even within a single state. Furthermore, it is not necessary to illustrate our main points.
What we’re doing instead is rather more simple. Our cost model estimates from the School Finance Indicators Database (SFID) allow us to approximate the cost of achieving common student outcome goals (estimated adequate funding levels) in virtually all New Jersey public school districts. We use these estimates to calculate racial/ethnic gaps in the adequacy of funding across the whole state (see Baker et al. [2021] for more details on our model). We call these racial “opportunity gaps,” and they are one way to measure the degree to which funding-related educational opportunity varies between groups (in this case, between races and ethnicities), accounting for both how much is spent and how much is needed. The opportunity gaps are calculated as follows:
- Calculate the “white adequacy gap,” which is the percentage difference between actual spending and estimated adequate spending levels (i.e., estimated “costs”) for the typical white student in the state;
- Using the same procedure, calculate the “Black adequacy gap,” “Hispanic adequacy gap,” and “Black/Hispanic adequacy gap” (both groups combined);
- Finally, we subtract the adequacy gap in step 1 from each of the three adequacy gaps in step 2 (three different opportunity gaps using three different racial/ethnic comparisons). The differences, in percentage points, tell you how much more or less adequate funding is for the typical student of color versus the typical white student in New Jersey.
The opportunity gaps, in other words, are differences between two adequacy gaps (e.g., the difference between the white adequacy gap and the Black adequacy gap). If, for example, white students, on average, are funded far more adequately than are their Black peers elsewhere in the state, that represents unequal opportunity; the white students are provided the resources to achieve higher outcomes than the Black students. In virtually all states, white students’ funding is more adequate than that of Black (and Hispanic) students. It’s only a matter of degree.
These first three opportunity gaps are calculated using New Jersey’s current district structure. We’ll call this the “fragmented” or “current” scenario. This is the actual situation in the state (in 2021, or the 2020-21 school year).4
Note that, for the purposes of this exercise, we define adequate funding in our cost model as spending levels required to achieve the common student outcome goal of Massachusetts average test scores. We choose this highly ambitous “benchmark” goal because it is more appropriate for New Jersey’s (high) standards than our usual benchmark of national average outcomes (Baker and Weber 2022). This affects whether actual funding for many districts is above or below estimated adequate levels, but using a different benchmark goal would not substantially affect our results. and it would not change our conclusions at all.5
Next we carry out the same opportunity gap procedure under a hypothetical situation of countywide consolidation. We collapse all of the state’s districts into their home counties by calculating a district enrollment-weighted average of both actual and estimated adequate spending (i.e., costs) within each county. We’ll call this the “consolidated” or “countywide” scenario. We then produce the same three opportunity gaps as we did above, so we can compare them with the fragmented scenario.
Figure 2 presents statewide racial opportunity gaps under the current/fragmented (blue bars) and consolidated scenarios (red bars). It may be helpful to review the three step process above using a specific result in the figure. For example, the leftmost bar in Figure 2 shows that, under New Jersey’s current, highly fragmented district structure, the opportunity gap between the typical Black and white student in the state is about -48 (-47.5) percentage points. Here is how that gap is calculated, using the three steps:
- White adequacy gap: The average white student’s district spends 9.5 percent above estimated adequate levels (by our aspirational Massachusetts standard);
- Black adequacy gap: The typical Black student’s district spends about 38.0 percent below our cost targets;
- Opportunity gap (difference between the gaps): -38.0 minus 9.5 = -47.5 percentage points.
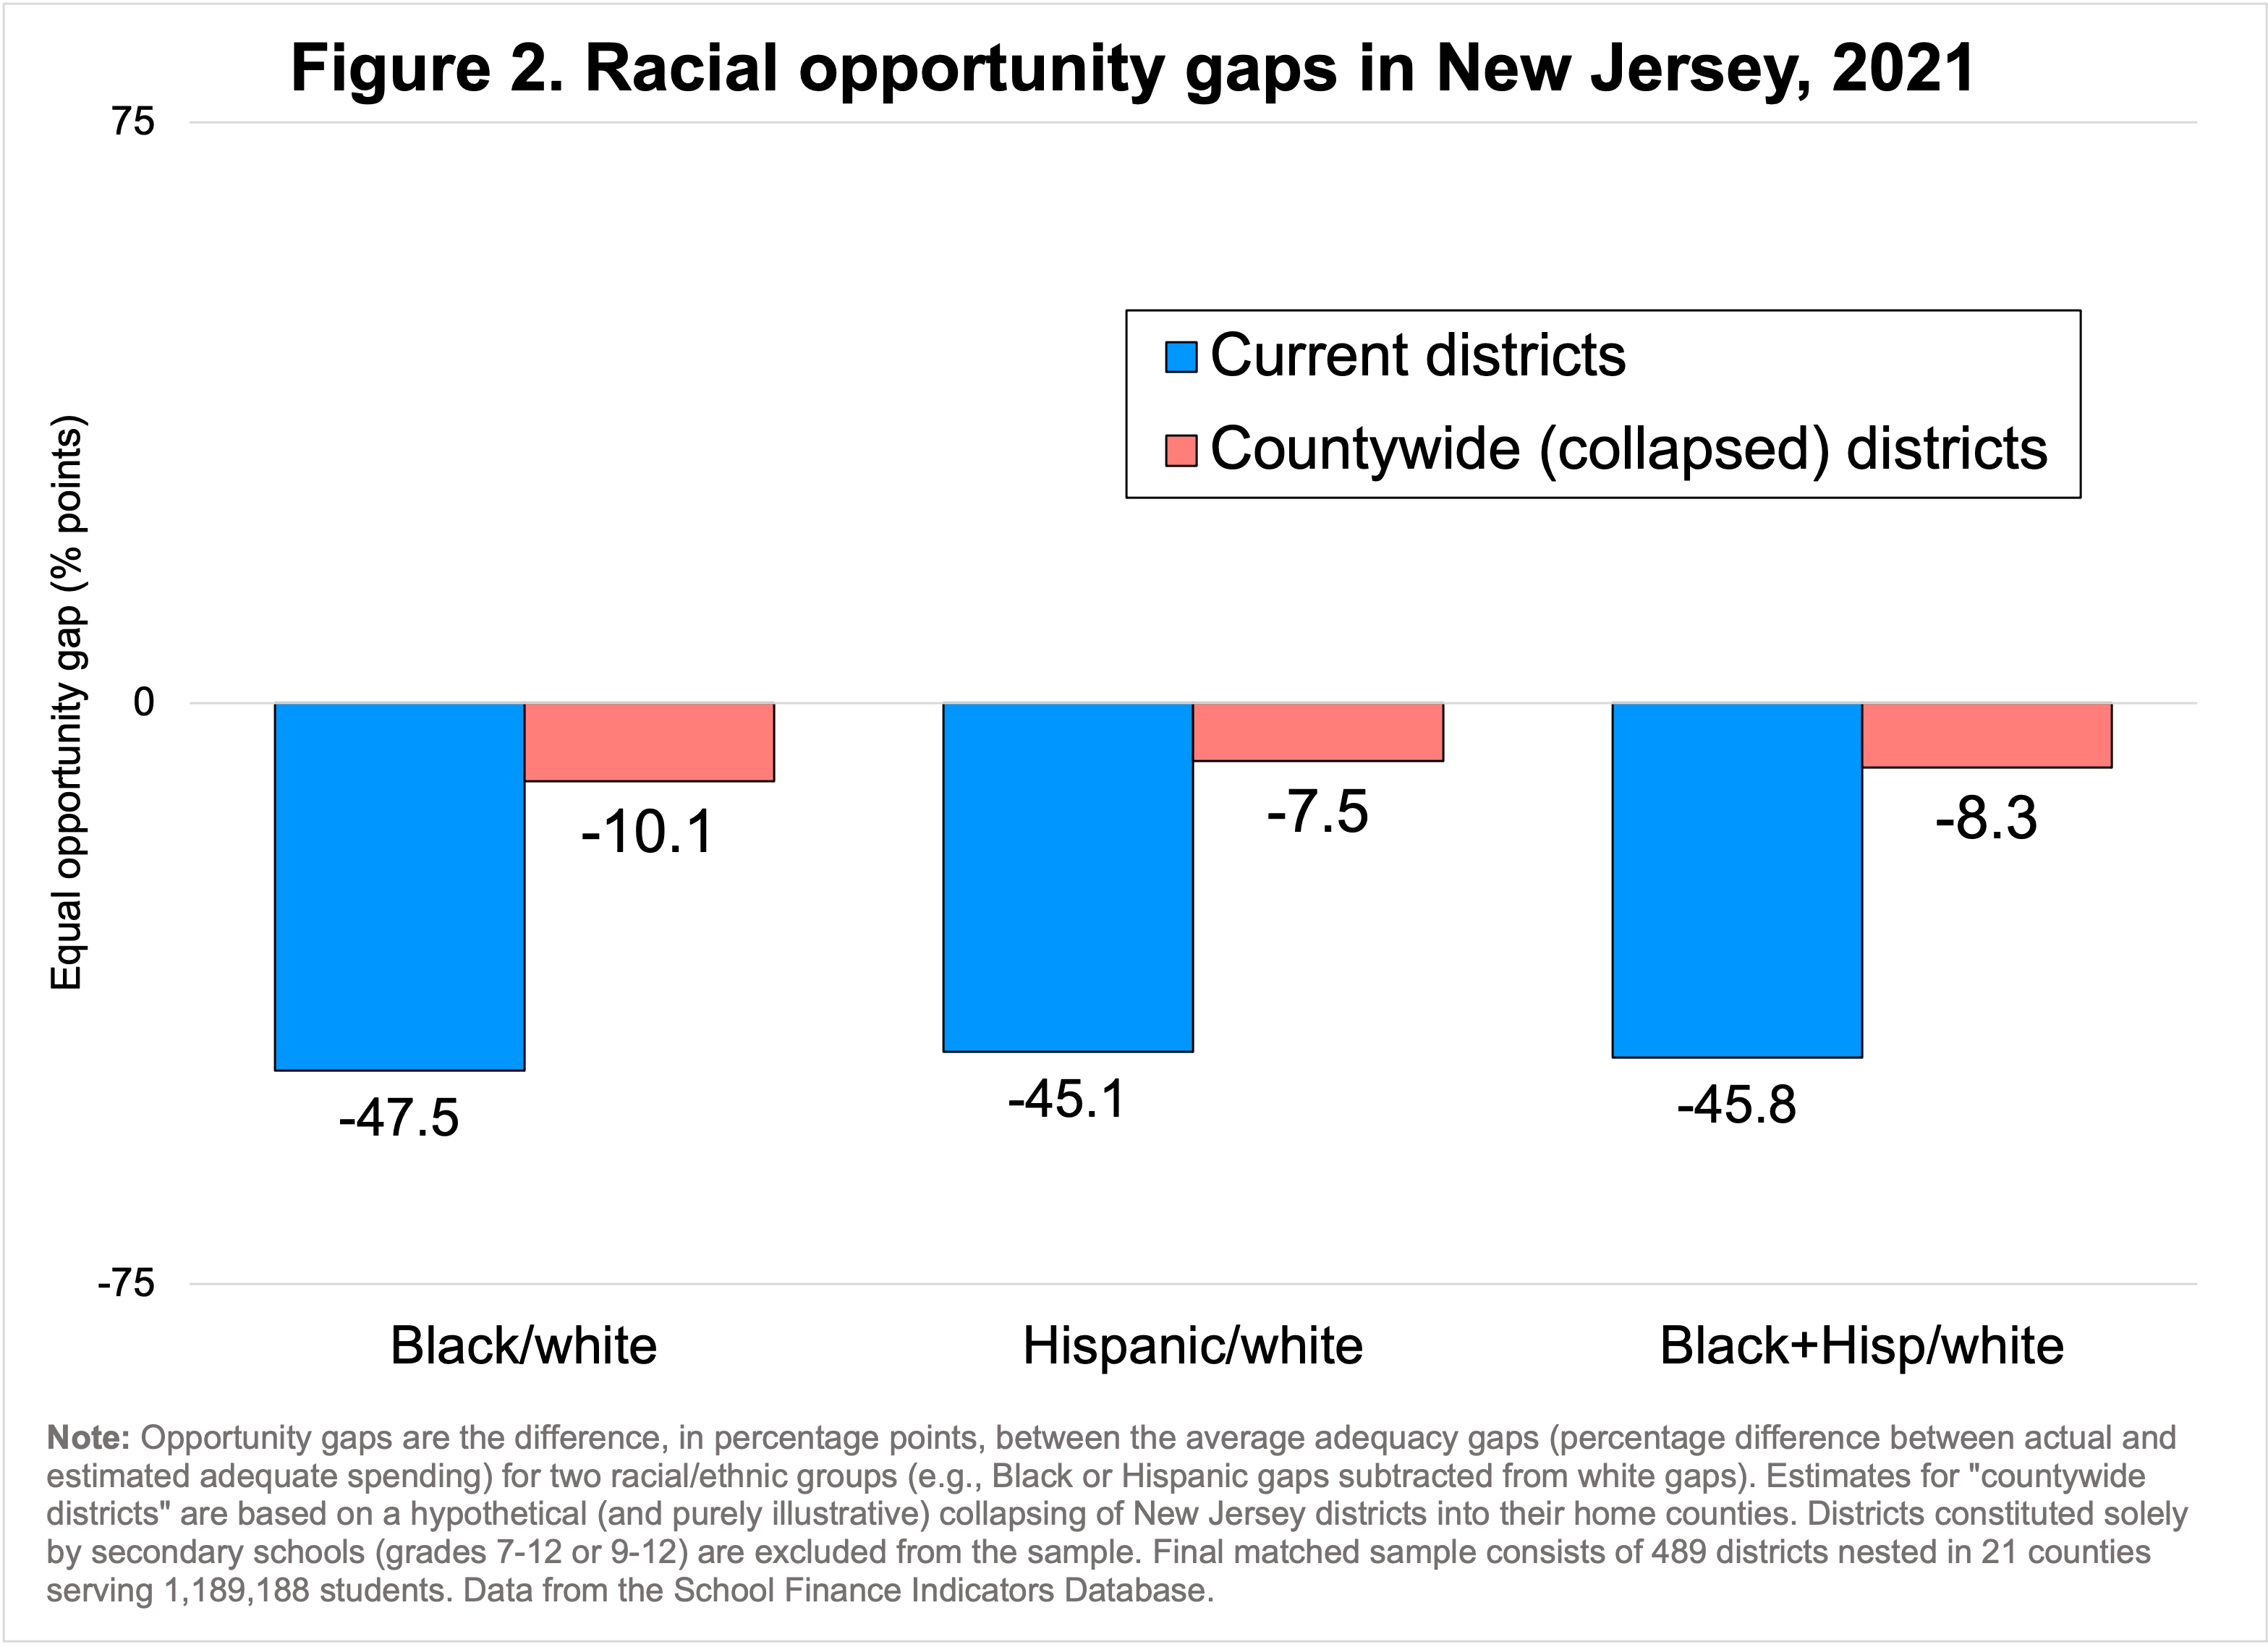
If we carry out these same steps under our collapsed countywide districts (red bars), this Black/white gap of -47.5 percentage points closes to about -10 (-10.1) points, a reduction of almost 80 percent. And we find similar reductions if we’re comparing Hispanic with white students (83 percent), and Black and Hispanic combined with white students (82 percent). This consolidation would move New Jersey’s racial/ethnic opportunity gaps from among the 10 largest in the nation to among the 10 smallest.
Now, here’s the important part: the reduction in opportunity gaps from our (illustrative) countywide consolidation is not due primarily to equalized spending between races/ethnicities. It is, rather, due to the sharing of costs.
Recall that our opportunity gaps are differences between two racial adequacy gaps. Both adequacy gaps are the percentage difference between two variables—spending and estimated costs—calculated separately for, say, Black and white students. Spending can vary widely between districts (and/or student subgroups), but so too can costs. It follows, then, that consolidation can affect opportunity gaps by changing racial/ethnic gaps in spending (i.e., how much students get), gaps in estimated adequate spending (i.e., how much students need), or some combination of both.
For instance, as mentioned above, districts score, on average, far below a given outcome goal (e.g., an average score on a test) will of course have to spend more to achieve that goal than will districts that score only modestly below (or above) that threshold (i.e., the former districts have higher costs). On a related note, districts with higher poverty rates and larger minority populations face challenges, such as recruiting and retaining teachers, that also require additional resources (e.g., higher salaries) to address (Lankford, Loeb, and Wyckoff 2002; Hanushek, Kain, and Rivkin 2004).
The key to good finance systems is to make sure that all districts have what they need—i.e., spending should be commensurate with the costs of achieving the common student outcome goals that each state chooses.
Let’s start with the “spending side” of this equation. Statewide averages are a coarse measure, but across New Jersey, the typical Black or Hispanic student’s district spends a few hundred dollars less per pupil than that of the typical white student—a very modest gap. There is a negative correlation between district racial composition and spending (i.e., unadjusted spending is higher in districts serving larger shares of Black or Hispanic students), but it is fairly weak.
In other words, if we conceptualize progressivity using district racial/ethnic composition instead of poverty, New Jersey school funding can be characterized as neither progressive nor regressive. It’s also, on a related note, non-progressive by district poverty (actually, according to our SFID spending progressivity measure, which adjusts for labor costs, population density, and size, New Jersey is among the 10 worst states in the nation in terms of district poverty-based spending progressivity).
It might be useful to illustrate these racial gaps in spending (or lack thereof) using the example of Essex County. Essex is New Jersey’s largest (in terms of student enrollment) and also its most internally segregated county. The scatterplot in Figure 3 presents the percentage of each Essex County district's students that are Black or Hispanic on the vertical axis, and unadjusted per-pupil current spending on the horizontal axis. You can see on the horizontal axis that Essex County districts spend between $18-26K per pupil. So, spending does vary, but there is virtually no relationship between spending and racial/ethnic composition (or, by the way, between spending and Census child poverty rates)—i.e., the dots in Figure 3 exhibit no consistent pattern. Some of the higher spending districts (located toward the right of the plot) serve mostly white students, others are more diverse.
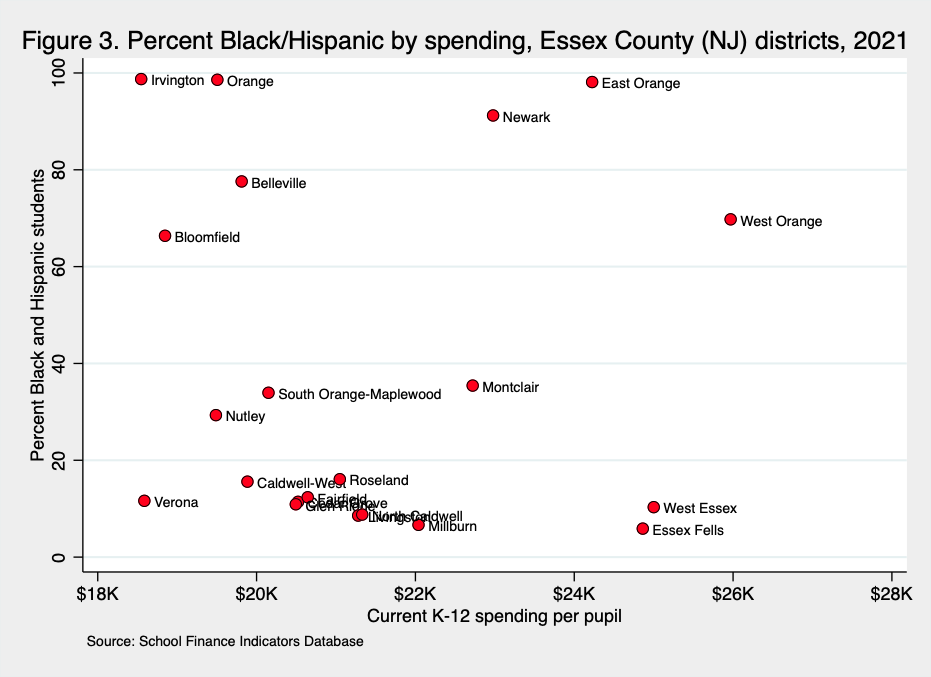
Our hypothetical countywide consolidation, therefore, does not affect racial gaps in spending because both white and Black/Hispanic students already receive roughly the same funding, on average (this is generally true in Essex and elsewhere). To reiterate, we’re looking into the possibility of carrying out this simulation in a manner that redistributes local property tax revenue. But for now, there is no significant racial/ethnic gap in spending between districts within counties, and so there’s also no gap if we pool spending across those counties.
But the factor that does fall along racial lines, and strongly so, is estimated costs (i.e., estimated adequate spending levels). This is clear in Figure 4, which is the same scatterplot as that presented in Figure 3, except the horizontal axis is now estimated costs per pupil (to reiterate, these amounts are based on the aspirational benchmark goal of Massachusetts average test scores, and so the actual per-pupil amounts are high, but this figure would look roughly the same using a different benchmark).
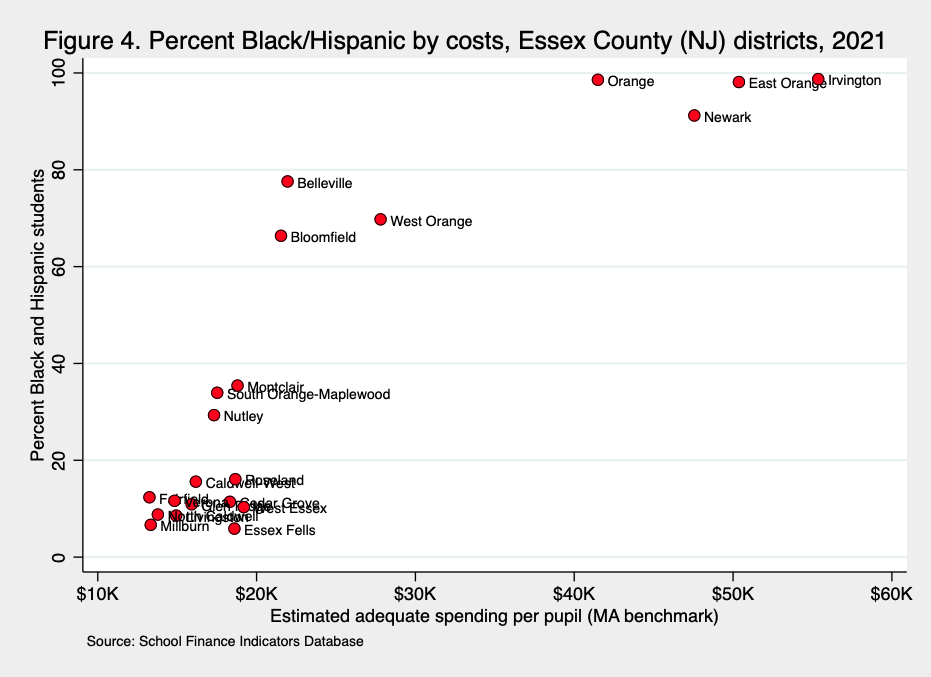
The Essex County districts serving the largest shares of Black and Hispanic students also have the highest estimated costs in the county, whereas those serving the smallest shares tend to have the lowest costs. For instance, according to our cost model estimates, the four districts serving at least 90 percent Black or Hispanic students (East Orange, Irvington, Newark, and Orange), which are located in the top right corner of the plot in Figure 4, would have to spend about four times more than the overwhelmingly white Essex County districts (bottom left of the plot) to achieve the same outcomes.
This huge gap in estimated costs is driven in no small part by the fact that the four districts serving largely Black and Hispanic students have an average Census child poverty rate that is nine times higher than their predominantly white counterparts (27 versus 3 percent), and score approximately 1.3 standard deviations lower than those white districts on math and reading tests (nationally-normed).6 These disparities are the result of structural barriers, such as the long-term economic disinvestment in Black and Hispanic communities. A large funding increase by itself would not guarantee the narrowing of the gaps in student outcomes in the short term. Nevertheless, we would argue that a large and sustained influx of resources is at least a necessary condition of such improvement.
To be clear, the racial/ethnic gaps in estimated costs between Essex County districts are particularly large—it is a highly segregated, high inequality county—but the same basic situation is found in most of the state’s other counties. Across the entire state, the typical white student’s district has a relatively modest Census child poverty rate (roughly 8 percent) and relatively high testing outcomes (0.29 s.d. above the national average). The typical Black or Hispanic student’s district, in contrast, is much higher in terms of poverty (18 percent) and scores 0.18 s.d. below the national average.
To bring it all together and illustrate what’s behind the reduction in opportunity gaps under our countywide scenario in Figure 2, Figure 5 presents statewide racial/ethnic gaps in both spending (blue circles) and costs (red circles), comparing New Jersey’s current districts with our hypothetical countywide districts. Again, these statewide averages mask a great deal of underlying variation, but they are sufficient for our purposes.
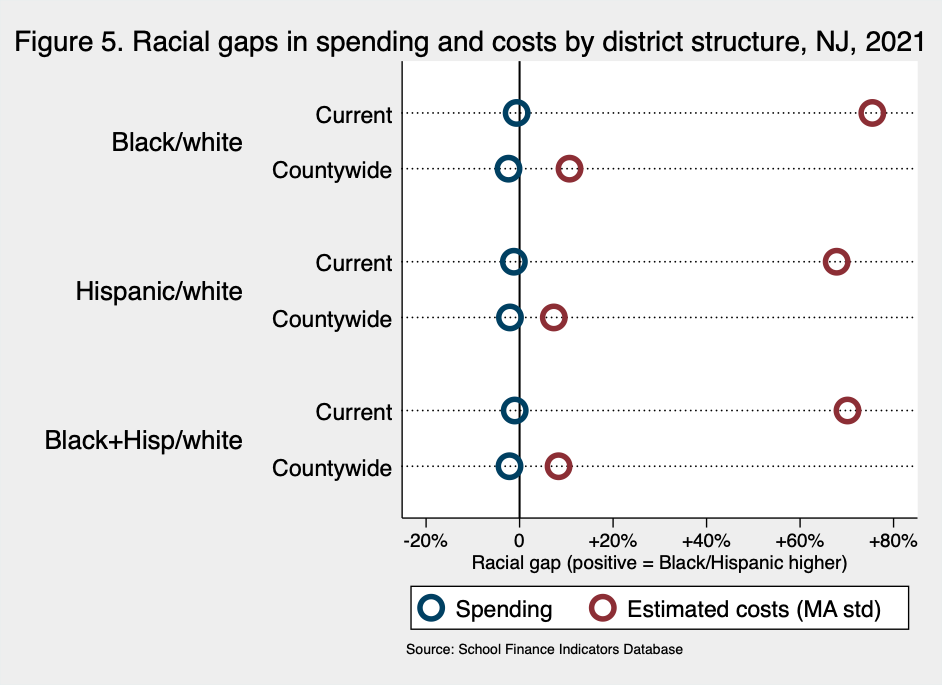
To reiterate, opportunity gaps, which are gaps within adequacy gaps, can decrease due to a decline in the racial/ethnic gap in spending, a decline in the racial/ethnic gap in costs, or some combination of both. For example, the topmost red circle in Figure 5 shows that, under the state’s current fragmented structure, the typical Black student’s district would have to spend about 75 percent more than that of the typical white student in order for both groups to be funded equally adequately (both groups would be funded to achieve the same outcomes). The corresponding spending gap (the topmost blue circle), however, is roughly zero (i.e., as mentioned above, spending is roughly equal between white and Black students’ districts). Therefore, the current Black/white opportunity gap in Figure 2 (-47.5 points) is driven by the fact that the typical Black student’s school district must spend a lot more to achieve equal opportunity but in reality only spends about the same amount.
Now, if we consolidate all districts into counties, the blue circle representing the Black/white spending gap barely moves, but the red circle (cost gap) moves from 70 percent down to roughly 11 percent—i.e., the typical Black student’s county would have to spend only 11 percent more than that that of the average white student. This is because the hypothetical consolidation of New Jersey’s highly fragmented, highly segregated districts into countywide districts effectively shares (in a sense, integrates) these costs.
This makes a big dent in the racial opportunity gaps (Figure 2), even though spending gaps remain mostly stable (due mostly to New Jersey’s non-progressive spending). There is still a Black/white opportunity gap (-10.1 points, as shown in Figure 2)—there is still a lot of remaining segregation between counties (see Figure 1)—but the opportunity gaps are far smaller when costs are shared across districts within counties.
Conclusion
What we have presented is just a simplified illustration, rather than an evaluation of the possible effects of an actual policy. First, putting aside the monumental political (and legal) challenges that would be entailed in statewide countywide consolidation, the newly consolidated districts would have to allocate funding to schools in an extremely progressive, targeted manner in order to achieve this level of gap reduction. (And that’s not even considering the problems that would have to be dealt with if the sharing of costs and resources was accompanied by a redrawing of attendance boundaries.)
Moreover, our results showing a reduction in opportunity gaps from countywide consolidation, if actually implemented, would be a mixed blessing of sorts. The countywide district structure essentially reduces statewide cost gaps (and thus opportunity gaps) by combining the high and low cost districts within counties. Since, however, total spending within those counties remains the same, the consolidation increases adequacy for the typical student of color and decreases adequacy for the average white student. Consolidation is not a substitute for better funding.
There are, rather, two important takeaways here, one conceptual and the other more practical. The first, more conceptual implication, which applies to all states, is that between-district segregation, whether by race/ethnicity or by income/poverty, doesn’t just isolate students and resources within district boundaries; it also isolates needs/costs. Even in states where spending is progressive, between-district segregation can generate large gaps in the costs of equal opportunity. The magnitude of these cost gaps usually dwarfs the progressivity of K-12 spending in the nation’s most progressive states (and, again, New Jersey is among the least progressive). From this cost-inclusive perspective, the equity implications of high between-district segregation are often more severe than is generally recognized, while the potential benefits of between-district integration may be underestimated.
The second, more practical implication is that New Jersey’s highly fragmented districts likely exacerbate unequal educational opportunity, but policymakers, in New Jersey and elsewhere, have viable options to address this problem. For one thing, they could narrow (or even close) race- or poverty-based opportunity gaps with reforms that direct more state aid at districts with the highest needs/costs and the least capacity to pay those costs with local revenue. This would narrow opportunity gaps by raising the floor rather than having the floor and ceiling meet somewhere in the middle. Most states do a better job of this than they have in the past, but virtually all are still a long way from equal opportunity (Baker et al. 2024).
But there are also effective, complementary options on the “segregation side” of the equation, particularly in highly fragmented states such as New Jersey. The Supreme Court’s Milliken decision does not preclude voluntary integration across district lines. A statewide policy by which all New Jersey districts were consolidated into countywide districts is not realistic for a variety of reasons (though note that several states do have county districts). However, while a strategic, targeted effort to consolidate small groups of adjacent districts in counties such as Essex would be extremely difficult, it is not outside the realm of possibilities. Moreover, less sweeping programs, such as inter-district tax-sharing, while also rife with challenges, are absolutely feasible (Diem et al. 2015; Holme and Finnigan 2013; Holme and Diem 2015). In fact, New Jersey's constitution explicitly bans school segregation, and since the mid-20th century, the state has made periodic efforts to encourage various forms of consolidation, including one initiative currently in progress. These efforts have met with resistance (including the very real complex issues and challenges entailed in consolidation), and have generally not been successful.
Once fragmentation occurs, it is very difficult to undo, and it is often a major obstacle to K-12 funding equity. Tiny affluent districts, fortified by sacrosanct boundaries, are not only able to raise much more local revenue (at lower taxation rates) than the high-poverty districts often a few minutes drive away, but they also have much lower costs. Fragmentation or not, it is the responsibility of states to ensure that some districts aren’t far more adequately funded than others. But this task is in many respects easier with larger districts sharing both resources and costs.
*****
1 New Jersey school districts, like those in every state, are actually far less fragmented than they were prior to the 20th century. As rural areas developed and increased in population, many thousands of tiny (mostly single schoolhouse) districts throughout the nation consolidated and re-consolidated. In New Jersey, a big chunk of this process was unusually quick: an 1894 law required townships to consolidate all schools within their borders into school districts. Virtually overnight, the number of school districts in New Jersey went from over 1,400 to about 300 (Bruck 2008;Schwam 2010). After that, new incorporations of boroughs (most of them during the mid- to late-1890s) brought the number of districts closer to its current total.
2 For example, we measure total statewide segregation between Black and white students (elementary schools only) at 0.495 using the IT index, and 0.678 using the dissimilarity index. Although there is no one correct way to interpret these indexes, both of these values are conventionally interpreted as high levels of segregation. Segregation between white and Hispanic students is lower but still high by conventional standards.
3 Figure 1 uses enrollment data from the National Center for Education Statistics in the 2020-21 school year. The calculations for the decomposition of the IT index come from Reardon et al. (2000). The estimates exclude students classified as “American Indian/Alaska Native,” “Asian or Asian/Pacific Islander,” “Native Hawaiian or other Pacific Islander,” and “Two or more races.” The “multiracial” decomposition in the figure is of segregation of Black, Hispanic, and white students as three separate groups. The estimates also do not include charter schools, but our results do not change if these schools are included as independent districts (in part because there are relatively few of them).
4 Our initial sample is limited to the 538 districts for which we have adequacy estimates in 2021 (which is virtually all non-charter regular public districts in the state). However, only about 220 of these districts serve a full/combined K/PK-12 grade range. Most of the rest are either K/PK-6 or K/PK-8, whereas a small group (fewer than 50 districts) serve only secondary grades (either 7-12 or 9-12); the latter districts are typically “fed” by multiple K/PK-6 or K/PK-8 districts in their areas. Some counties are constituted by predominantly combined districts, others primarily by elementary (or K-8) districts that feed into secondary school districts, and still other counties are a mix of both. The estimates presented in Figures 2-5 include only combined (K/PK-12) and elementary (K/PK-6 or K/PK-8) districts (489 districts total). The extent of gap reduction (Figure 2) is generally similar between the two groups of districts, though it is moderately less pronounced among elementary compared with combined districts.
5 Higher benchmark goals increase estimated costs and make spending appear more inadequate (or less adequate), but this happens for all racial/ethnic groups, and the “gaps in these gaps” stay relatively consistent. It’s very roughly analogous to measuring the difference in height between two people, and doing it again after they both stand on park benches. They’re both taller on the benches, and the benches may vary slightly in height, but the gap between them won’t change much.
6 The student outcome gaps are nationally-normed and come from the Stanford Education Data Archive. Regarding the cost gaps between the highest- and lowest-poverty Essex county districts, we cannot say if four times more is the “correct” cost gap—and this discussion is beyond the scope of this post—but we would contend that it is well within the realistic range given the districts being compared (Jackson and Mackevicius 2024). Moreover, even if the true cost gap is far smaller, the racial/ethnic opportunity gaps would still be substantial.
This blog post has been shared by permission from the author.
Readers wishing to comment on the content are encouraged to do so via the link to the original post.
Find the original post here:
The views expressed by the blogger are not necessarily those of NEPC.