School Finance 101: On Short-Term Memory & Statistical Ineptitude: A Few Reminders Regarding NAEP TUDA Results
Nothin’ brings out good ol’ American statistical ineptitude like the release of NAEP or PISA data. Even more disturbing is the fact that the short time window between the release of state level NAEP results and city level results for large urban districts permits the same mathematically and statistically inept pundits to reveal their complete lack of short term memory – memory regarding the relevant caveats and critiques of the meaning of NAEP data and NAEP gains in particular, that were addressed extensively only a few weeks back – a few weeks back when pundit after pundit offered wacky interpretations of how recently implemented policy changes affected previously occurring achievement gains on NAEP, and interpretations of how these policies implemented in DC and Tennessee were particularly effective (as evidenced by 2 year gains on NAEP) ignoring that states implementing similar policies did not experience such gains and that states not implementing similar policies in some cases experienced even greater gains after adjusting for starting point.
Now that we have our NAEP TUDA results, and now that pundits can opine about how DC made greater gains than NYC because it allowed charter schools to grow faster, or teachers to be fired more readily by test scores… let’s take a look at where our big cities fit into the pictures I presented previously regarding NAEP gains and NAEP starting points.
The first huge caveat here is that any/all of these “gains” aren’t gains at all. They are cohort average score differences which reflect differences in the composition of the cohort as much as anything else. Two year gains are suspect for other reasons, perhaps relating to quirks in sampling, etc. Certainly anyone making a big deal about which districts did or did not show statistically significant differences in mean scale scores from 2011 to 2013, without considering longer term shifts is exhibiting the extremes of Mis-NAEP-ery!
So, here are the figures…. starting with NAEP 8th grade math gains for 10 years, against the initial average score in 2003.
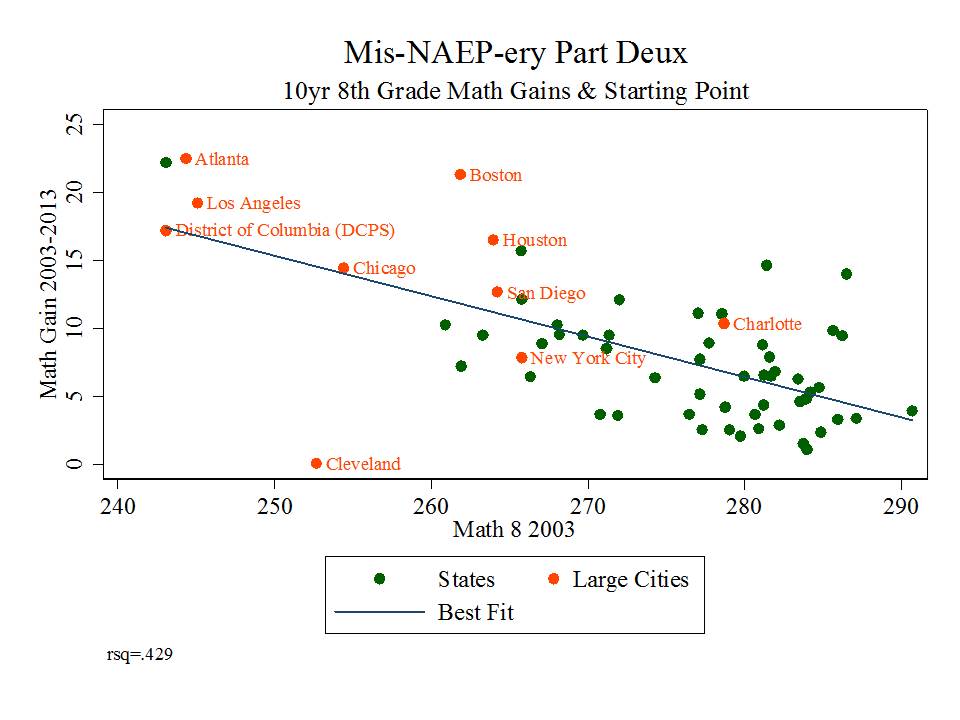
The relationship between 10 year gains on 8th grade math and initial average score is relatively strong. DC and LA which appear to be getting the early applause for their reformy amazingness pretty much fall right in line with expectations. Boston is a standout here… and Cleveland? well… that’s a bit perplexing, but Cleveland reveals perplexing data on many levels in ed policy (including some of the consistently highest school level low income concentrations in the nation).
The relationship for reading is not quite as strong:

LA is lookin’ pretty good here, but starting pretty darn low – lower than DC… which, by the way, really isn’t a standout here on 10 year gains. Cleveland? well… not a pretty sight… Other cities fall pretty much in line with expectations given their initial 2003 mean scores.
Here are the 4 year gains for math grade 8:

DC looks a little better here… but as previously, cities fall among the states in roughly their expected locations- but for Cleveland and Detroit, which seem to lag. San Diego, a relative standout on 10 year gains, lags on 4 year gains, but that’s hardly a condemnation of a city that a) has made longer term gains and b) as of 2009 sits among the higher performing jurisdictions.
Finally, here’s the 4 year gain for reading grade 8:

This relationship is certainly less consistent. DC falls more or less in line. Cleveland and Milwaukee aren’t lookin’ so good. San Diego is back above the line, but having started and remaining lower in the pack than they were on math.
Again, the big caveat here is that these aren’t “gains” but rather cohort differences. And one might suspect population change to occur more quickly in cities than in states, especially in those cases where cities have smaller overall student populations than states (setting aside those pesky low population states like VT, WY, etc.).
What to make of this all? Not much really. Does NAEP TUDA provide broad condemnation of urban education in the U.S. Well, only to the extent that NAEP generally provides such condemnation, since cities and states tend to fall in line with one another (but for some notable standouts). Do these data present us with obvious pictures about current policy preferences or directions? Well, that would be hard to assert given that these data don’t really present us with consistent pictures – but for the fact that starting point matters, and my previous post illustrating how demography matters.
This is by no means to suggest that policies and practices don’t matter, but rather that frequent, egregious misinterpretation of NAEP data provides no value-added to the policy conversation. (yeah… I said value-added!?)
This blog post has been shared by permission from the author.
Readers wishing to comment on the content are encouraged to do so via the link to the original post.
Find the original post here:
The views expressed by the blogger are not necessarily those of NEPC.
