School Finance 101: The Subgroup Scam & Testing Everyone Every Year
This post is a follow up to my previous post in which I discussed the misguided arguments for maintaining a system of annual standardize testing of all students.
In my post, I skipped over one argument that seems to be pretty common among the beltway pundits. I skipped this argument largely because the point is moot if we plan on using testing data appropriately to begin with. My point in the previous post was about tests, testing data and how to use it appropriately. But just as the beltway pundit crowd so dreadfully misunderstands tests and testing data, they also dreadfully misunderstanding demography and geography and the intersection of the two. A related example of the complete lack of demographic “data sense” in the current policy discourse is addressed in my recent post on “suburban poverty.”
Among other issues I addressed in my previous post, the beltway crowd is up in arms that if we don’t test every kid every year, we’ll never have sufficient “n” – sample sizes – well actually “N” subpopulation sizes [since this is about testing everyone] – to really know how “subgroups” of students are performing – and more importantly – to apply to a school’s accountability rating! And that, of course is critical to the use of testing for the protection of children’s civil rights. But of course, this argument assumes many things.
For example, the pundits over at Bellwether explain:
Arne Duncan has estimated that hundreds of thousands of students were invisible to state accountability systems because of n-size issues. CAP has praised states in the past for lowering their n-sizes, but their plan to have fewer students “count” toward a school’s accountability rating would mean less attention on important subgroups of students. [ http://blog.bellwethereducation.org/grade-span-accountability-is-a-bad-idea-just-ask-cap-and-the-aft/ ]
There are so many layers of problems in this explanation it’s hard to know where to even begin. In this post, I critique the following three assumptions underlying this claim of urgency for retaining annual testing of everyone:
- First, that testing everyone every year actually solves the problem of having sufficient numbers of children in each subgroup, in each school and district, to be able to make meaningful comparisons among them.
- Second, that the subgroup classifications we use for “testing-based-accountability” purposes are, in fact, meaningful distinctions – meaningful ways to characterize student populations and measure differences among them.
- Third, that the measures we are constructing of student outcomes for making comparisons between these subgroups are somehow meaningful and useful for characterizing school performance. In other words, that we aren’t violating the basic rules I set forth in my previous post, by, for example imposing penalties/sanctions on schools merely for exhibiting the presence of difference in proficiency rates or average scores between group A and group B.
Each of these assumptions is suspect!
Let’s break it down.
Population UNiverse Data Breeds IrratioNal ExuberaNce over “N”
As outlined so eloquently by ArNe DuNcaN (as characterized in the Bellwether blog), one impetus for maintaining testing everyone every year is so that poor and minority children don’t end up being “invisible” when it comes to rating school performance!
We must know the gaps between black and white where black children attend majority white schools, and vice versa.
We must know how poor children are performing in rich schools, and vice versa.
If we don’t test all children every year, we’ll miss those ten black kids in the white school, and those ten Hispanic kids in the black school!
We might even overlook the vast differences in proficiency rates between those 10 Asian kids and those tend black kids in the predominantly white school!
Leaving such gaping holes in our ability to label, takeover, close, reconstitute local public schools is entirely unacceptable!
First, most kids don’t attend racial and economically diverse schools. The differences across our educational system are mainly between schools and districts, not within them. As such, within school subpopulation sizes of subgroups are nearly always insufficient. Second, the common form of these measures – differences in average proficiency between these small groups (where even measurable) – are utterly meaningless as “school accountability” indices (more on this later). Using them for this purpose is reckless and irresponsible.
American public schools remain highly segregated. Elementary schools often enroll about 300 to 500 children, grades KG to 6 (with variations, of course). So, that’s just under 60 kids per grade level who might fall into a tested subpopulation. 10 kids are about 17%. But, in highly segregated metropolitan areas, many schools are either black or white (greater than 85% one or the other). For illustrative purposes, let’s use that 85% threshold as a threshold at which we are unlikely to have sufficient subpopulation size of any subgroup making up the other 15% (among tested students) even when testing everyone. Figure 1 shows the percentages of statewide white students in these racially diverse northeastern states, attending schools that are over 85% white, and percentages of statewide black students attending these schools that are over 85% white.
Figure 1. Whites and Blacks in White Schools

In New Jersey, a population dense and racially/ethnically diverse state, nearly 1/3 of white students attend schools that are over 85% white. Only about 2% of the state’s black students attend these “white” schools. 15 to 20% of black students in New Jersey attend schools that are over 85% black. While Pennsylvania has a larger share of black students attending “white” schools – about 7% of black students statewide – in Pennsylvania, nearly 2/3 of white students attend “white” schools.
In other words, even when testing everyone, lots of schools will have no measures of subgroup gaps to count either for or against them, because those schools are so highly segregated that they include no subpopulations of sufficient “N.” Thus, we are relegated to deciding which among the integrated/diverse schools to slap with sanctions!
New Jersey, in its waiver thin nouveau-Duncanian accountability policy, uses “achievement gaps” between subgroups, and low subgroup performance as a basis for state intervention – labeling schools deemed as problematic in this regard as “focus schools.”
But most of the focus school labels are earned by completely erroneous classification resulting from subpopulation size thresholds achieved through aggregation.
As I’ve shown in previous blog posts, the schools assigned this distinction are nearly all “middle schools” in racially diverse school districts. Why is that? Why aren’t the elementary schools also labeled as focus schools? Well, that’s because the elementary schools simply don’t have enough students in the subgroup to count. But, when they all come together – perhaps from two or three elementary schools of about 400 kids, into a middle school of about 800 to 1200 kids, all of the sudden there enough to count. Nothing has really changed except that minimum subpopulation size thresholds have been met. The fact that the gaps are measured – and used to enforce sanctions on middle schools – is merely a function of aggregation. It’s meaningless, ignorant and data abuse.
I’ve actually (half-jokingly, only half, mind you) recommended to my students who are middle school administrators that they thwart this anomaly of aggregation by working with district leadership to reorganize their middle schools into many separate schools, co-located, shall we say. Give them different names. Apply for a charter for one corner of your school. Sort kids in randomly across these new “schools” within the original school and viola… no more subgroups to count in any one school! No more focus group status!
Testing every kid every year, in my view, actually exacerbates the subgroup comparison problem because it generates this false sense confidence in “evaluating everyone” on which policymakers then rely in making completely fallacious judgments about schools.
The Subgroups Aren’t Meaningful Distinctions for Informing Policy or Judging Schools
I’ve addressed poverty achievement gaps on a number of occasions, including how and why our measures of poverty are often insufficient, especially where those measures are constructed by ramming arbitrary cut-points through varied income distributions across settings. And I’ve addressed on numerous occasions more broadly, problems with the ways in which we measure poverty in education policy analysis.
Racial classifications only seem more straightforward, since they are clearly groups (categorical variables), not some arbitrary cut point rammed through a continuous distribution. But that’s not in fact true. Racial classifications used in education policy, as in NCLB, are equally arbitrary clustering of economically, socially and educational diverse racial and ethnic sub-sub-populations.
Current policies, including those used for assigning sanctions to schools in states like New Jersey rest on evaluating gaps between Blacks, Whites, Hispanics and Asians, assuming these distinctions to be educationally, economically and socially important. Back in 2000, a colleague (Lisa) her doctoral student (Christine) and I, after a long conversation over lunch, decided to do a little exploring into this topic – asking ourselves – isn’t it quite possible that the differences among sub-sub-populations are actually greater than the differences in aggregate populations? And further, what’s the sense behind these aggregate groupings anyway?
We specifically explored the composition of the “Asian” and “Hispanic” classifications, where “Asian” (including “Pacific Islander”) included everything from Samoan to Sri Lankan, Japanese, Korean, Hmong, Laotian, etc. It was hard, even from the most American-Centric (Vermont raised white guy point of view) to presume any coherence to this classification. Using data from the National Educational Longitudinal Study of the 8th grade class of 1988, we found:
In the case of both the Hispanic and Asian/Pacific Island aggregate groups there are substantial, though not always statistically significant, academic performance differences among ethnic subgroups, with a range of math performance among Hispanic subgroups of 10.7 points (mean score = 34.4) between Cuban and Puerto Rican students and a range of math performance among Asian/Pacific Island students of 15.3 points (mean score = 41.0) between West Asian and Pacific Island students.
http://epx.sagepub.com/content/14/4/511.short
Why does this matter? Who cares? So there are some differences among the subgroups, which sometimes are even bigger than the differences between the aggregate groups. Well, it certainly matters if we are using, say, test score gaps between Hispanic and White students to decide which school should be subjected to sanctions – especially if one school’s Hispanic population is predominantly Cuban and middle class and another school’s is predominantly recent Mexican immigrant or lower income Puerto Rican families.
The implication of the sanctions imposed on those serving one type of “Hispanic” immigrant versus another is – Why can’t you turn your Hispanics around like they did? This is offensive on so many freakin’ levels! What about the district serving an “Asian” population dominated by middle class Filipinos versus more affluent Koreans? Do we say – what’s wrong with your Asians and why aren’t they performing like their Asians? That’s what current policy does with no regard for the nuance of racial/ethnic (national origin, generational status, etc) classification and the organization of communities with respect to patterns of immigration.
Here a are few snapshots of New Jersey.
First, using U.S. Census American Community Survey data here are the aggregate and breakout populations for large New Jersey cities (and some combinations of cities).
Jersey City has a sizable Hispanic population share. But notably, using these still relatively coarse grained categories, the area in and around Jersey City has a Hispanic population that is mostly “Other” as well as slightly more Cuban, and far less Mexican and Puerto Rican than other cities in New Jersey. Jersey City’s Asian population is substantially Filipino as well as Indian, differentiating it from other parts of the state.
Figure 2. Aggregate Group Distribution and Breakout of Hispanic and Asian Populations of Families with School –Aged Children

Figure 3 shows the average income differences across aggregate groups relative to whites in the same city/area. Not surprisingly, Blacks and Hispanics tend to have lower family income than whites, and Asians have similar to or higher than white income.
Figure 3. Differences in Income Relative to Whites for Aggregate Groups

But these aggregations can be really deceiving. For example, Figure 4 shows that while Mexican and Puerto Rican family income does tend to be lower than white income, the income of families of school aged children for those of Cuban national origin is comparable to and in Trenton, higher than white income.
Figure 4. Differences in Income Relative to Whites for Disaggregated Hispanic Groups
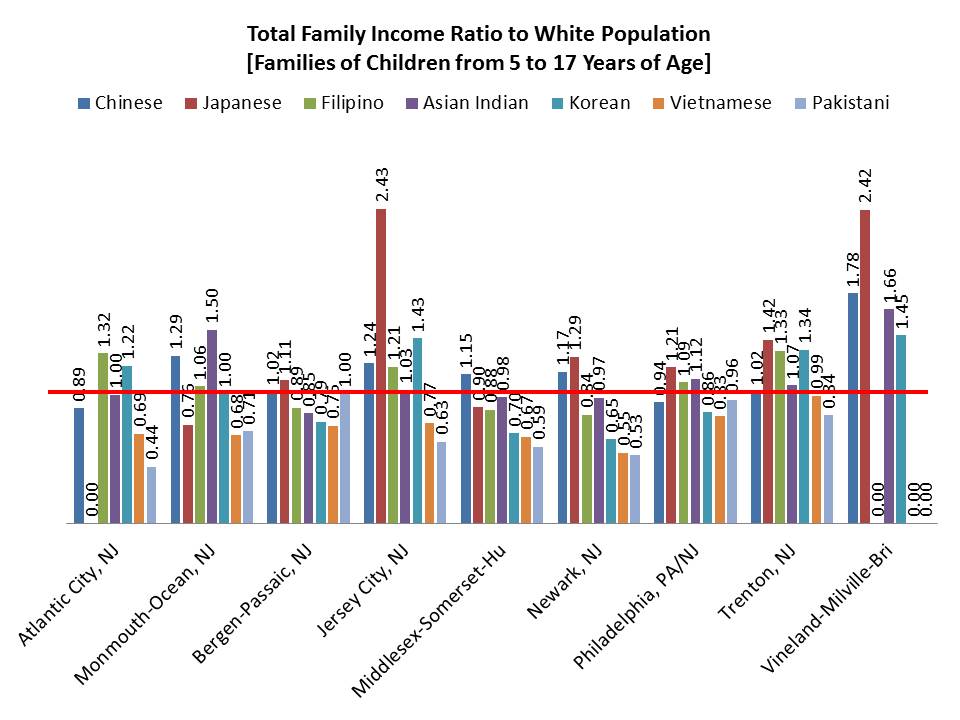
There exists similar variation across Asian sub-subgroups.
Figure 5. Differences in Income Relative to Whites for Disaggregated Asian Groups
Gaps in Proficiency Rates within Schools Aren’t Meaningful!
Finally, even if the group classifications were meaningful and even if testing everyone every year created sufficient “N” for comparison purposes, one is left to ask… are we using these data in meaningful, informative appropriate ways to begin with? What the heck does a subgroup proficiency gap even mean in terms of school performance? Well, here’s what Matt Di Carlo over at Shankerblog has had to say on this topic:
Gaps based on proficiency rates are not fit for use in most any context. When you measure gaps using proficiency rates, you are basically converting test scores into “yes or no” outcomes for two groups (in the case of income, groups also defined by conversion into “yes/no” outcomes), and then comparing those groups. There is no need to get into the technical details (see, for example, Ho 2008 for details), but the problem here is even worse than it is for overall, non-gap measures such as schoolwide proficiency rates. Proficiency-based gaps, particularly over time, are so prone to distortion that they are virtually guaranteed to be misleading, and should be used with extreme caution in any context, to say nothing of using them in a formal, high-stakes accountability system. There are alternative ways to measure gaps using proficiency- and other cutpoint-based rates (e.g., Ho and Reardon 2012), but I haven’t yet seen any states using them.
In other words, I’m not the only curmudgeon who thinks this whole endeavor is folly. And if the endeavor is folly, then so too are arguments favoring the maintenance of data to support that endeavor.
To Summarize
The bottom line here is that:
Even when you test every kid every year, you don’t have appropriate subpopulation sizes for individual institutions to make meaningful distinctions, because of the way in which our schools are organized and segregated.
The subgroup distinctions, be they differences in test scores above/below arbitrary income thresholds, or between highly aggregated racial/ethnic classifications aren’t particularly meaningful to begin with.
As it is, subgroup data are being used to calculate junk measures and to use them entirely inappropriately (as if there was an appropriate use to begin with?)
So, as it stands, policymakers are taking meaningless measures of outcome differences between arbitrary groupings of student populations and using those measures to make high stakes determinations about the jobs of teachers and principals.
While there are indeed racial disparities within diverse, tracked high schools and middle schools in America that should not be overlooked, the most substantial racial disparities across our educational system are those between schools – and more importantly – between districts serving substantively different student populations by race, ethnicity, national origin and economic status. These differences can and should be captured via appropriate stratified sampling methods, and more fine grained characterizations of our diverse student population.
But more importantly, when collected this information should be used appropriately!
This blog post has been shared by permission from the author.
Readers wishing to comment on the content are encouraged to do so via the link to the original post.
Find the original post here:
The views expressed by the blogger are not necessarily those of NEPC.
