TIMSS: Always Claiming the Grass is Greener on the Other Side of the Globe
International science and environmental education have been a major focus of my professional work, and so when results on international comparisons are released by TIMSS (Math and Science, PIRLS (Reading), or PISA (Math, Reading & Science), I am eager to write about what these results mean.
On this website there have been many posts devoted to an analysis of international test results and the comparisons that fill the airwaves, the Internet and newspapers. In the United States (and in other countries as well) the perception of science (and mathematics) education is driven by published rankings based on science or mathematics achievement test scores.
A few days ago TIMSS and PIRLS released 2011 data on worldwide assessments in mathematics, reading and science.
In the 1980s through 2000 I was involved in a global or international science and environmental science project that began as a collaboration with Soviet science teachers, researchers, and professors of science and ecology. I’ve written about it here and here. Over the years I traveled more than 25 times to Russia and to other republics in the former Soviet Union, and was involved in teaching in Russian schools, as well as collaborating with other Americans and Russian educators to create the Global Thinking Project, an international science program. It was an inquiry-based environmental science project in which teachers worked with their students on local environmental issues and questions, used the Internet to collaborate, report, and discuss their findings with peers in other countries. With time, many other countries joined our effort. Some of these included Argentina, Australia, Botswana, Czech Republic, Japan, and Spain.
The TIMSS assessments began in 1995, and have continued to the 2012 report, and will continue into the foreseeable future through 2015. In 1995, at a National Science Teachers Association (NSTA) annual meeting, there was a session on TIMSS at which the directors of the project, many of which represented different countries, spoke about the new international assessment. I happened to be in attendance, and after the session, I expressed serious doubts about such assessments and later comparisons that would be made. Even though the directors will tell you that comparisons really are not a valid exercise, it seems to me and many other educators, that comparisons are all that the media seems to report.
Scoreboards
In the media, the way TIMSS and other international (or national) test results are reported is using the sports metaphor of league standings. TIMSS is kind of analogous to the Olympics in that the main reason for competing is to take home the gold. In fact, according to the historical record of TIMSS, the U.S. students never score high enough to even merit a bronze medal. If your country’s students don’t score high enough to get into the top three or four, reports fly in national and local newspapers claiming that the sky is falling, and that the nation’s education is in perilouscondition.
The 2012 TIMSS report immediately identifies East Asian countries among the top performers in TIMSS 2011. Also high percentages of East Asian students reach TIMSS international benchmarks. Benchmarks are classified by score as low, intermediate, high, and advanced. These are arbitrary and do not have any basis in research. They are simply a way to differentiate and classify test ranges. The media focus on findings such as these, and leaves the impression that comparisons across countries are valid, and helpful. They are not.
Leader board based on TIMSS Scale Score
Nearly all reports in the media use the data in the first two columns of the chart that I created based on TIMSS 2011, the name of the nation and the TIMSS scale score (either 4th or 8th grade). Bear in mind that there were 49 countries that participated in TIMSS 2011. I’ve only listed the top 19. Note that the top five countries are East Asian and Finland. The U.S. is in tenth place.
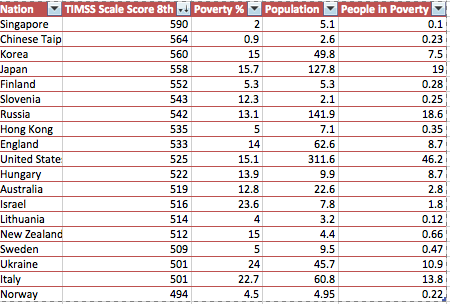
Figure 1. TIMSS Leaderboard based on Science Test Scores, Grade 8
Leader Board Based on Poverty
Very few reports discuss the issue of poverty and its relationship to TIMSS scores. Here we have listed the countries in descending order based on CIA statistics on poverty levels in the participating nation. Of the top 19 scoring countries, the U.S. has the 5th highest poverty level. According the most recent data, the U.S. has a poverty level of 15.1. Notice that the number of people in the U.S. living in poverty is 46.2 million. Why we continue to compare countries using average achievement test scores is beyond me. As many researchers have pointed out, if you don’t take into consideration the poverty concentration of schools, comparisons are meaningless.
The fact is comparisons are simply meaningless, and don’t give one iota!
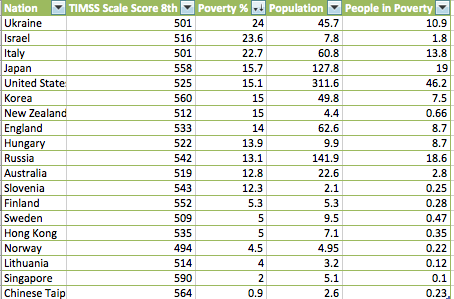
Figure 2. Nations Listed By Poverty Levels
What is the relationship between student’s scores on TIMSS and poverty? The Pearson correlation coefficient was used to determine the strength of the linear association between poverty and TIMSS scores in 8th grade science. As we can see here, there is an inverse relationship between 8th grade science scores and the poverty levels in these nations. The poverty levels, which ranged from 0.9 percent to 24 percent, show a strong negative relationship with science scores. I The Pearson r for the TIMSS 8th grade Science score and Poverty level = -0.39, which means there is a moderate to negative relationship; in this case the higher the poverty level, the lower the science scale score.
Unless we acknowledge the effect of poverty on achievement, comparisons among countries are not valid. And if you take a look at Figure 1 again, notice the variation in population for the top 19 countries. The countries that score at the top of the leader board have populations that range from 2.6 – 15 million, except for Japan which has 127 million people. Compare that to the population of the U.S. which is 311 million. How can an average score for a country like the U.S., make any sense? The U.S. has more than 13,000 school districts.
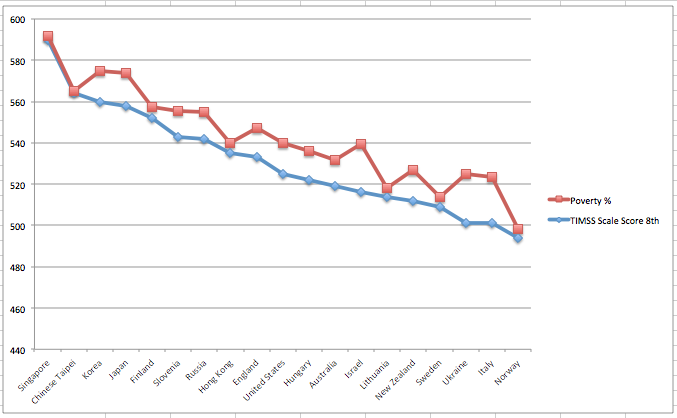
Figure 3. Graph of the Relationship between 8th Grade Science Scores and Poverty Levels
There are many factors that affect student performance on international tests. Here are some more factors that play a major role in student achievement as measured on the TIMSS assessment.
Home Resources
As other researchers have reported, socioeconomic factors such as resources available to students greatly affects the success in school. TIMSS used parents’ reports to decide the level of resources. Notice that the same inverse relationship with poverty is present here.
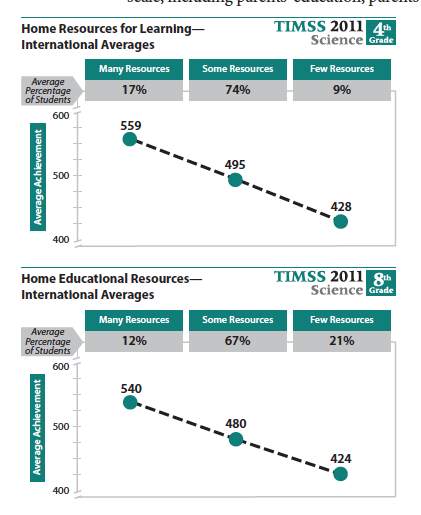
Relationship between home resources and science scores at the 4th and 8th grade levels.
Affect of Affluence, Safety and Bullying
It is not surprising that students living in affluence and attending schools in affluent neighborhoods do better on tests than students who live and attend schools in poor neighborhoods. The TIMSS report does discuss the implications of poverty on test scores. In fact, the word “poverty” only is used once in the 517 page report. Instead of using the concept of poverty, the managers of TIMSS use the term “disadvantaged.” Again affluence was directly and positively related to science achievement.
Students also do well on achievement tests when they are in safe environments, there is hardly any discipline problems, and very little bullying.
Student Attitudes
TIMSS reported that students said they liked science did well, and students who had confidence in their ability to learn science, also did well. In project ROSE: The Relevance of Science Education, researchers at the University of Oslo studied the factors of importance to the learning of science and technology (S&T), as perceived by learners. One finding in the ROSE project was that there was difference in the attitudes of students in Western industrialized nations compared to students in Developing Countries. It is important to note that students valued science and technology, but students in Developing nations had a positive attitude toward learning science, because students from Western nations tended to have more negative attitudes of school the longer they were in school.
Teaching and Teacher Preparation
According the TIMSS 2011 report, teacher preparation and experience teaching were significant factors in student achievement. Teachers who had strong background in content and pedagogy were more successful in helping student learn science and math. And teachers with at least 10 years of experience were the most successful in teaching reading at the 4th grade level, and mathematics and science at the 4th and 8th grade levels.
This is a significant finding in light of the burgeoning business of Teach for America which claims to be successful by preparing teachers to teach in the most difficult schools. According to TFA, it only requires five weeks of summer training to get élite students ready to teach in urban schools. According to independent research, TFA recruits teach for only a couple of years. However, Anthony Cody over on Living in Dialog writes that Wendy Kopp, TFA founder and CEO claims that on average TFA recruits stay in teaching for eight years. Independent research studies show this not be true, that TFA teachers stay in the classroom for a little more than 2 years on average.
One More Thing
Is the grass greener in other countries? Is is a valid and useful exercise to test nearly a million kids every few years to publish a report that only pushes the buttons of politicians and policy makers? What do you think?
This blog post has been shared by permission from the author.
Readers wishing to comment on the content are encouraged to do so via the link to the original post.
Find the original post here:
The views expressed by the blogger are not necessarily those of NEPC.