The Art of Teaching Science: In Spite of the “System,” Urban Teachers Have a Record of Success
In spite of the “System” the evidence is that urban teachers have a record of success, not one that is spiraling down. The present state of reform of American education is based on the idea that American students are doing poorly, and this will lead to disastrous economic consequences, and the loss of American’s place in the global economic competition.
But, education (for our students) should not be a competition. There is no need to have winners and losers as outcomes of the school experience. Education is about learning, and in an environment that has as its core belief that learning is the fundamental goal of schooling. Students are living in the present, and their school experience should be based on their lives now, and should not be based on furthering the economic prosperity of society. Schooling should not be based on job training, career readiness or college entry. It should be based on fostering the creative and innovative aspects of youth, and create school as a learning environment designed to help students learn to collaborate, work with others to solve problems, and engage in content from the arts and the sciences that has personal meaning.
We’ve been told that urban education in America needs to be saved by pouring advise and money from the élite and influential corporations and philanthropic groups. The problem is that these groups are focused on only one set of outcomes that all come down to increasing student academic performance measured by high-stakes examinations.
I want to show here that urban teachers have held their own for the past decade and half in spite of the problems they face in their schools day-to-day. They not only have held their own, but the evidence shows that academic performance of their students (in mathematics at the 8th grade) in the example below has slowly but surly increased as shown in Figure 1. As you can see, in Atlanta, students at the 25th, 50th and 75th percentile increased performance on NAEP tests given from 2003 through 2013.
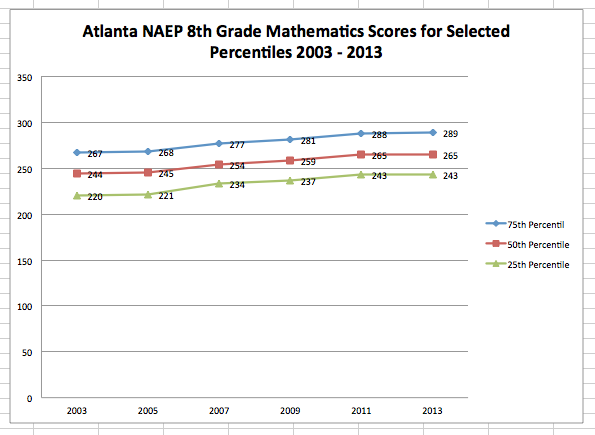
Figure 1. Atlanta NAEP 8th Grade Mathematics Scores for Selected Percentiles 2003 – 2013.
Reading and Math in Urban Schools
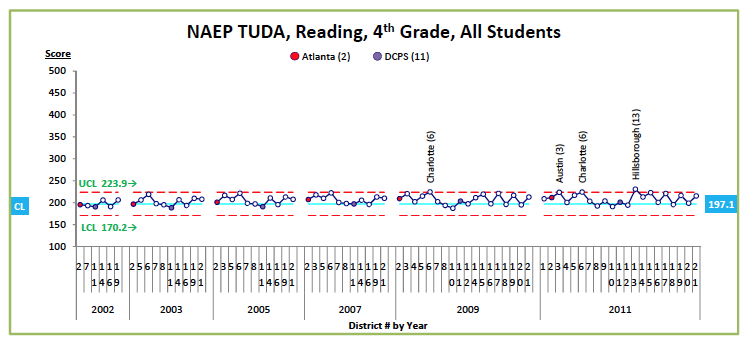
Take a look at the next four figures (Figures 2 – 5). They were compiled by Mr. Ed Johnson in his study of the NAEP Trial Urban District Assessment (TUDA). Johnson, who is a student W. Edwards Deming, examined the TUDA results through a Deming Lens. A Deming Lens means that to understand the behavior of a system, one must look at the system. Breaking down a system into its parts (goals, policies, finances, curriculum, teachers, administrators, parents, directors) loses one’s ability to understand the system.
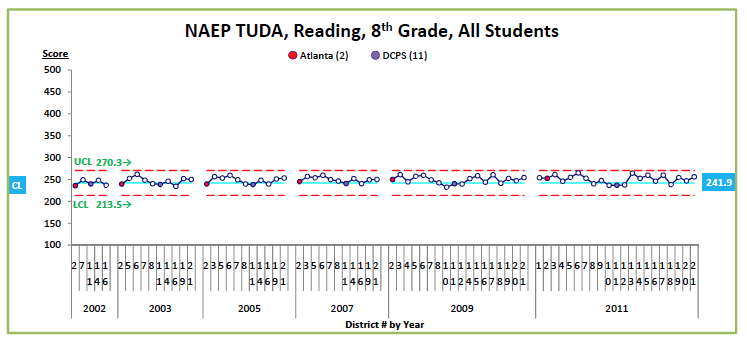
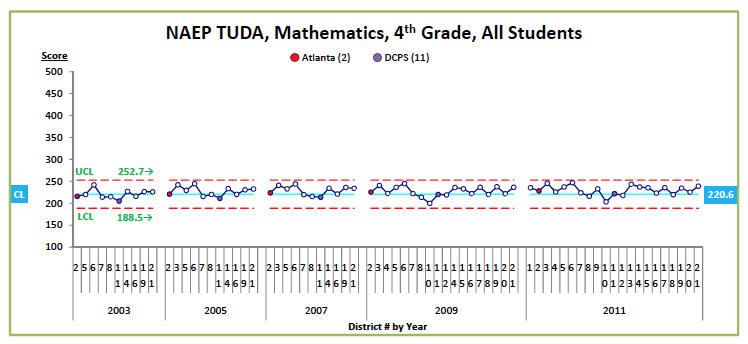
Each of the graphs below shows the behavior of these four systems over ten years. You will notice that there is variation in the achievement scores of students in reading (grades 4 and 8) and mathematics (grades 4 and 8) from one testing period to the next. But the variation is within upper and lower limits that would be expected in each system.
Causes of Variation in Scores
According to W. Edwards Deming 94% of the variation is due to the nature of the system, not the people who work in or make the system work. Only 6% are attributable to special causes. (W. Edwards Deming. The New Economics for Industry, Government, Education (p. 33). Kindle Edition).
As you look over the graphs you will see ONLY FOUR instances where the variation in scores lies outside the Upper Control Limit (UCL), and then only in 4th grade reading Examples include: Charlotte, 2009, Austin, 2011, Charlotte, 2011, and Hillsborough, 2011. Except for these four instances, all the variation is due to the nature of the system.

Figure 2. Location of Cities in the Trial Urban District Assessment; Gold triangle-higher than large city; Circle–not different; Blue triangle-lower than large city. Source: Nations Report Card. Click on Map for more details.
The graphs below plot reading and math scores for 21 school urban school districts. Mr. Johnson highlighted Atlanta (in red) and DC Public Schools (purple). As you can note in the following graphs, achievement scores in reading and math for Atlanta and DC Public Schools fell within the Upper and Lower Control limits. There is no radical change in scores, either up or down. It appears that the teachers in these urban schools are doing the job they were hired to do and that is help their students learn how to read, and do mathematics. And they’ve done this in spite of all the issues that surround schools in urban communities.
In systems thinking, as Mr. Johnson would tell us, there are two types of causes of variation in any system. The most important cause of variation in any system is what we call “common causes” of variation that is really a function of the system itself. Examples of common cause variation will fall within control limits on a graph (as shown below in Figures 2 – 5). Examples of common causes that influence variation (scores on tests, for example, or graduation rates) include
- High percentage of children from low SES groups.
- Where the school is located. It’s zip code.
- Age of the school building.
- Size of the school system.
- Underpinning policies, practices, procedures of the school which determines it’s culture.
- Inadequate resources.
According to Deming, nearly all outputs of schooling are the result of common cause variation, and these would include drop out rates, achievement test scores, violence, bullying, gang activity, low self esteem, attitudes, under performance and literacy skills.
Defying Gravity
When we examine a school system from a systems thinking view, these outputs are causes by the day to day effects of common causes of variation. As Deming and other systems thinkers, such as Ed Johnson would say, trying to seek achievement scores beyond what see in the graphs (Figures 2 – 5) is to “defy gravity.” Reformers have charged ahead as if they can “defy gravity” and have put the blame of not improving test scores in the wrong place.
Managers (administrators) and workers (teachers) are not “common cause” variables. However, since schools are based on a linear factory model, “reformers” ignore common causes, and instead claim that teachers and administrators can overcome the challenges posed by common causes. When reformers insist on market reforms, and they don’t work, they blame the teachers and principles. And to make matters worse, they use student test scores (which are the result of common causes) to evaluate teachers on the basis of false assumptions about schooling.
We think that the present system of reading and mathematics is fairly stable. The output in reading and math (as measured by a test score) vary little, and one can make predictions about future reading and math output.

We will explore systems thinking in future posts. But for now, what do think about the analysis of the NAEP TUDA data as compiled by Ed Johnson?
This blog post has been shared by permission from the author.
Readers wishing to comment on the content are encouraged to do so via the link to the original post.
Find the original post here:
The views expressed by the blogger are not necessarily those of NEPC.