School Finance 101: When Evidence Based Isn’t: Informing State School Finance Formulas to Provide Equal Educational Opportunity for All
First, a bit of review:
Goals of state school finance systems
- The goal of state school finance systems is to provide all children, regardless of where they live or attend school, equal opportunity to achieve common, adequate outcome goals
- Providing equal educational opportunity toward common goals costs different amounts in different settings, and across children (individually and collectively) by needs and contexts
- State accountability systems set common goals and evaluate schools (and children) on whether they meet those goals.
- A fair system requires funding sufficient to provide equal opportunity to meet these mandates (which are often used for articulating constitutional rights).
Two basic approaches to cost estimation
- Input-oriented analyses identify the staffing, materials, supplies and equipment, physical space, and other elements required to provide specific educational programs and services capable of producing the desired educational outcomes for identified student populations being served in various settings.
- Outcome-oriented analyses start with student outcomes that are generated by the programs and services offered by existing schools and districts. This type of analysis examines the relationship between spending on these programs and services and specific outcomes, while taking into account different student populations and the characteristics of the settings in which they are being served.
Limitations of Input-Based Approaches
- As a general rule of thumb, input-based analyses (or input driven formulas) fail to capture the full additional costs to provide equal opportunity in high need settings, while often overstating the costs of meeting minimum standards in low need settings. In short, they tend to inflate the base and deflate the weights[1]
- Differences in input-based approaches:
- In one approach, panels of experts and practitioners are asked to populate templates of prototypical schools with resources they believe are needed to achieve a set of outcomes they’ve been provided.
- Proposals of this type are useful but merely a hypothesis of what might be needed, lacking direct analysis of the relationship between those resources and outcomes
- Panelists with experience in low need, well resourced districts are hesitant to suggest their districts (or prototypes like them) would need fewer resources to achieve less than they currently do, thus overstating base costs.
- Panelists with experience in high need, but often under-resourced districts tend to underestimate the full needs/costs to meet outcome targets.
- In one approach, panels of experts and practitioners are asked to populate templates of prototypical schools with resources they believe are needed to achieve a set of outcomes they’ve been provided.
- Supposed “Evidence-Based” approaches are even more problematic in this regard:
- A single “evidence based” model of a prototypical school – designed to meet a state’s (in particular, every state?) specific outcome goals – simply doesn’t exist!
- There is a dearth of evidence on staffing ratios, specific models and reforms to inform incremental differences in per pupil costs to achieve common (state adopted) outcomes.
Cost-Modeling is the only valid method for understanding cost variation with respect to outcomes
Put bluntly, outcome-based methods are the only methods which actually meet, or can meet the requirement of estimating costs associated with achieving common outcome goals.
- Outcome based methods are the only methods which directly include the outcomes in question.
- Outcome based modeling, or “cost function” modeling is also the only of these methods for which there exists a significant track record in peer reviewed literature, specifically around the question of understanding how much more or less it costs for one child versus another, in one location versus another toward achieving common outcome goals. [2]
- Back in 2004, Tom Downes, an economist from Tufts University explained back in 2004: “Given the econometric advances of the last decade, the cost-function approach is the most likely to give accurate estimates of the within-state variation in the spending needed to attain the state’s chosen standard, if the data are available and of a high quality” (p. 9).[3] Since that time, data quality and access have improved significantly.
Informing state school finance policies with education cost models is a three-step process, but is relatively straightforward (more detailed policy briefs linked at each step).
- Step 1: Goal Setting
- Setting outcome goals and selecting measures of those goals for all students
- Understanding the current position of students in the state with respect to outcome goals
- Step 2: Modeling the cost of meeting goals
- Using statistical modeling to understand the relationship between existing spending, students served, economic and geographic context, and outcomes attained.
- Uses multiple years of actual data on school and/or district spending, outcomes, students and context to estimate spending associated with specific outcomes, under specific conditions.
- Is state specific in terms of outcome measures, expectations and actual district spending and conditions
- Using the fitted model to predict the spending associated with specific outcome goals (at average efficiency production)
- Uses multiple years of actual data on school and/or district spending, outcomes, students and context to estimate spending associated with specific outcomes, under specific conditions.
- Using statistical modeling to understand the relationship between existing spending, students served, economic and geographic context, and outcomes attained.
- Step 3: Translating cost model estimates to a weighted funding formula
How bad* are the results of an “evidence based” analysis?
*inequitable, inadequate and invalid
Unfortunately, it’s very easy with input-based analyses to advise state legislatures that they only need to do slightly more than they are currently doing, and that any new resources added to the system can be relatively evenly spread across schools, districts and the children they serve (meaning across political constituents).
Consultants lose some control over this process when deferring to expert judgment panels. Consultants maintain the greatest control over their ability to tell legislators what they want to hear when using “evidence” based models, because the evidence simply isn’t there for specifying additional programs, services and staffing ratios associated with achieving common outcomes – and in particular, the state’s own outcome goals. The “evidence” is in the eyes of the “expert” consultant.
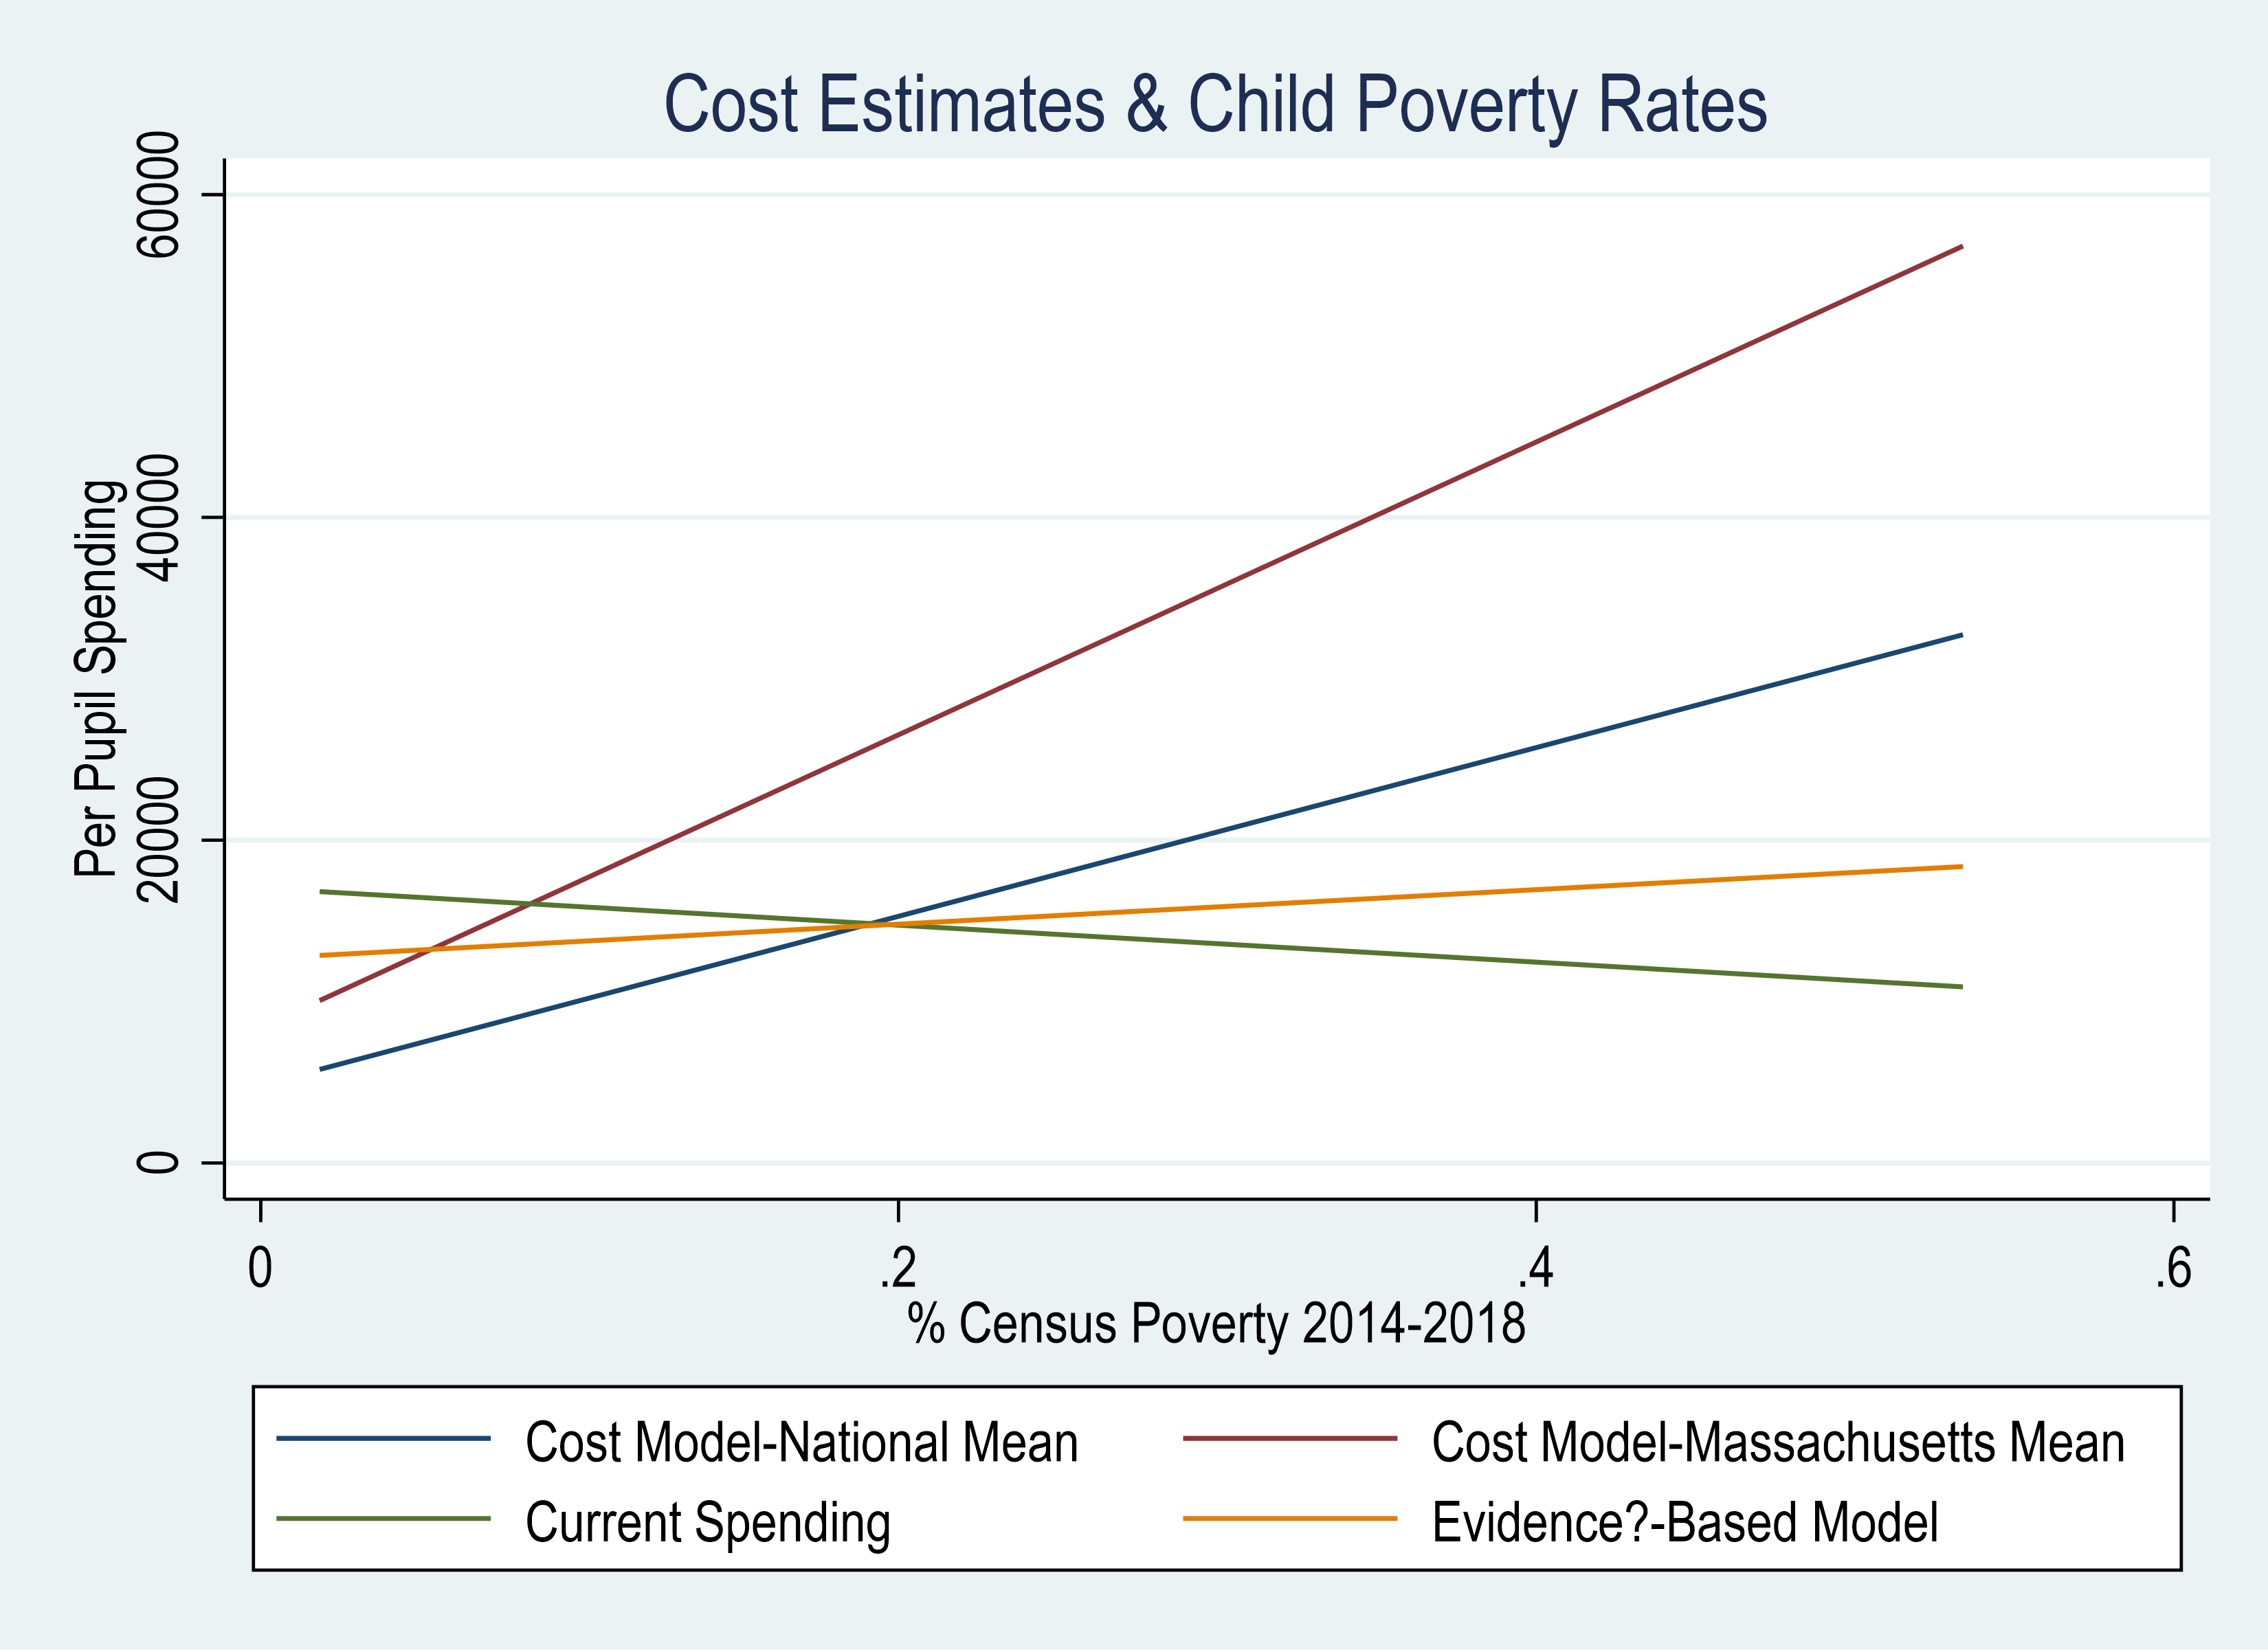
Figure 1 below compares a) current spending per pupil, b) the Illinois “Evidence Based” model per pupil costs, and c) two different cost model projections – costs to achieve national average outcomes and costs to achieve a higher outcome goal – Massachusetts average outcomes.
Presently, in Illinois (or at least historically), current spending per pupil has been systematically lower in higher poverty settings, despite substantial evidence that it costs more to achieve common outcome goals in higher poverty settings.[4] Illinois school finance has been “regressive” with respect to poverty. The Illinois “evidence based” formula adopted in 2017[5] conveniently suggests the need for only marginal increases in spending for the highest poverty districts, and only marginally above the average “cost” for much lower poverty districts. It’s a politically palatable solution and it is better than the system it replaced. (a positive step for sure, after decades of none – but not at all what it claims to be!)
The new formula does not even come close to providing equal educational opportunity to achieve common outcome goals – especially in high need settings – whether low goals – like national averages on reading and math assessments, or higher aspirational goals like Massachusetts averages.
Figure 1.
Based on: FY22-Evidence-Based-Funding-Full-Calc (Final Adequacy Target per Student)
Table 1 puts some specific numbers on current spending versus cost targets from the state’s EB model and our National Education Cost Model. Sorted by poverty quintile, the Evidence Based model suggests only modest increases for the highest poverty quintile and does, on average, suggest that much lower poverty districts could get by with less than they presently spend.
But, the difference between the EB cost estimates for the highest and lowest poverty districts is only 22%. It is highly unlikely that the highest poverty districts could achieve common outcomes with the lowest poverty districts with only 22% additional funding. Typically, it would take more in line with 2x to 3x the per pupil funding to close these gaps, especially in a state with the extent of wealth and income inequality of Illinois. Less unequal states have less cost variation.
Compared against the low bar outcome standard of national average outcomes – an outcome exceeded on average in Illinois – the EB model underestimates costs by a modest but understandable margin. But the EB model especially fails to recognize just how little could be spent in the most affluent Chicago suburbs to merely achieve national average test scores. This is a political compromise and a political compromise paid for by reducing the additional “cost” estimate for high poverty districts. That is, depriving those children of equal opportunity!
Anyone who works with state legislatures to inform the reform of state school finance formulas knows that whatever comes out the back end of the political debate – whatever is eventually adopted – will involve political compromise. As I explain in my recent book on the state of Kansas, the goal is to toss the best possible empirical evidence into the political scrum such that what comes out the back side is “less bad than it might have otherwise been,” in the absence of that evidence.
Because of this, it makes little sense to throw into that political scrum, cost estimates that are pre-emptively politically compromised by expert consultants – based on what they believe legislators want to hear (and what we all know most of them do want to hear). Yes, nearly any state legislature wants two things in school finance reform: a) a revenue neutral solution and b) no losers. This is of course impossible, but many who advise state legislatures will find a way to tell them they only need to add a little more and they can spread it relatively evenly. This is rarely in line with valid estimates of equal educational opportunity and adequacy.
Table 1.
| Quintile | Current (2018) | EB Model | ECM National Mean | ECM Mass Mean | Current Outcomes (Standard Deviations Over/Under National) |
| 1-Lowest | $16,347 | $12,771 | $6,899 | $11,975 | 0.500 |
| 2-Low | $16,492 | $13,340 | $8,844 | $15,350 | 0.286 |
| 3-Middle | $14,829 | $13,940 | $11,047 | $19,174 | 0.000 |
| 4-High | $15,219 | $14,405 | $13,062 | $22,671 | -0.149 |
| 5-Highest | $14,517 | $15,525 | $17,815 | $30,921 | -0.365 |
| Chicago | $14,134 | $15,991 | $18,102 | $31,420 | -0.287 |
| Wilmette | $18,578 | $11,684 | $3,813 | $6,619 | 0.862 |
Let’s take a look at where Chicago and Wilmette fall in our data visualizations of existing spending – compared to costs of national average outcomes – and actual outcomes. In short, just as the quintile average spending gaps above align with the outcome gaps (for our models, but not for the EB models), the City of Chicago is shown to fall in the lower left quadrant – spending less than needed to achieve national average outcomes (by several thousand per pupil) and fall below national average outcomes. By contrast, Wilmette spends well above what would be needed to achieve only national average outcomes, and far exceeds national average outcomes.


Validity Check
Here’s where it gets particularly fun. Here, I apply a validity check – a basic smell test – on the evidence based model compared to our national cost model. It would stand to reason that districts estimated to need more to achieve any specific outcome target likely currently fall below that target. Further, that districts with larger funding gaps would have larger outcome gaps – though an imperfect scatter.
The evidence based funding gaps – between 2018 per pupil actual spending and 2022 adequacy targets – don’t comport even with this basic validity check. Yes, districts that far exceed the relatively flat cost estimates, do have much higher outcomes. But, there are nearly as many districts that were estimated to fall below their EB funding targets that already exceeded national average outcomes (upper left) as there are that fell below national average outcomes (lower left). And, as can be seen here, the EB model suggests relatively small, nearly the same increases in funding for the large number of above average outcome districts and below average outcome districts. This is simply nonsensical, unless you factor in that the recommendation itself – certainly the adopted version of it – is more political compromise than valid cost estimate. That is, the whole point was to argue some basis for giving lots of districts small increases to politically appease, rather than providing what was actually needed to achieve common outcomes.
Figure 4.

By contrast, Figure 4 shows the relationship between our national cost model funding gaps and actual outcomes, Here, the relationship is much clearer (as it is in the data visualizations above). Districts with larger funding gaps also, not surprisingly, have larger outcome gaps. Because that’s what the actual connections – the underlying statistical relationships – in the data reveal.
Figure 5.

Why does this matter?
If the goal of a state school finance system, or the overarching state constitutional requirement is that all children shall have access to a basic set of prescribed inputs to their schooling, then input based methods absent outcome based validation may be appropriate. But this is rarely the case.
If states wish to impose common outcome requirements – standards and accountability – on public schools, as every state does and as federal statutes and regulations require – then states should be obligated to calibrate their funding formulas to provide all children equal opportunity to achieve those outcomes.
Anything less is inherently unfair and it is most certainly unfair to penalize children, their schools or teachers if appropriate, equitable and adequate funding, reasonably calculated to achieve those goals has not been provided.
It is irresponsible of those who should know better to continue to provide state legislators the political cover to continue depriving children – mainly low income black and brown children – equal opportunity to achieve common, adequate outcome goals.
We have common, widely accepted frameworks for understanding and evaluating equal educational opportunity and adequacy.
We have rigorous methods for estimating costs which comport with these frameworks.
Let’s use them and work toward not merely state systems, but a national system of public schooling that provides equal educational opportunity for all to achieve the outcomes we desire and they deserve.
Four Major Studies
- KANSAS
- Taylor, L., Willis, J., Berg-Jacobson, A., Jaquet, K., & Caparas, R. (2018). Estimating the costs associated with reaching student achievement expectations for Kansas public education students: A cost function approach. San Francisco, CA: WestEd. Retrieved from https://probstforprogress.com/wp-content/uploads/2018/03/kansas_adequacy_study_cost_function_approach_20180315_final.pdf
- Duncombe, W., Yinger, J. (2006) Estimating the Costs of Meeting Student Performance Outcomes Adopted by the Kansas State Board of Education. Prepared for the Kansas Legislative Division of Post Audit https://www.maxwell.syr.edu/uploadedFiles/cpr/research/cpr_research_education_finance_policy/Kansas_Report.pdf
- VERMONT
- Kolbe, T., Baker, B.D., Atchison, D., Levin, J. (2019) Pupil Weighting Factors Report. State of Vermont, House and Senate Committees on Education. https://legislature.vermont.gov/assets/Legislative-Reports/edu-legislative-report-pupil-weighting-factors-2019.pdf
- NEW HAMPSHIRE
- Baker, B.D., Atchison, D., Levin, J., Kearns, C. (2020) New Hampshire Commission to Study School Funding, Final Report: https://carsey.unh.edu/sites/default/files/media/2020/09/20-12685_nh_final_report_version_v5_draft_1.pdf
[1] Baker, B. D. (2006). Evaluating the reliability, validity, and usefulness of education cost studies. Journal of Education Finance, 32(2), 170-201.
National Research Council. (2008). Common Standards for K-12 Education?: Considering the Evidence: Summary of a Workshop Series. National Academies Press.
[2] Duncombe, W., Yinger, J. (2008) Measurement of Cost Differentials In H.F. Ladd & E. Fiske (eds) pp. 203-221. Handbook of Research in Education Finance and Policy. New York: Routledge. Duncombe, W., Yinger, J. (2005) How Much more Does a Disadvantaged Student Cost? Economics of Education Review 24 (5) 513-532. Duncombe, W.D. and Yinger, J.M. (2000). Financing Higher Performance Standards: The Case of New York State. Economics of Education Review, 19 (3), 363-86. Duncombe, W., Yinger, J. (1999). Performance Standards and Education Cost Indexes: You Can’t Have One Without the Other. In H.F. Ladd, R. Chalk, and J.S. Hansen (Eds.), Equity and Adequacy in Education Finance: Issues and Perspectives (pp.260-97). Washington, DC: National Academy Press. Duncombe, W., Yinger, J. (1998) “School Finance Reforms: Aid Formulas and Equity Objectives.” National Tax Journal 51, (2): 239-63. Duncombe, W., Yinger, J. (1997). Why Is It So Hard to Help Central City Schools? Journal of Policy Analysis and Management, 16, (1), 85-113. Imazeki, J., Reschovsky, A. (2004b) Is No Child Left Beyond an Un (or under)funded Federal Mandate? Evidence from Texas. National Tax Journal 57 (3) 571-588.
[3] T. Downes, What Is Adequate? Operationalizing the Concept of Adequacy for New York State (2004), http://www.albany.edu/edfin/Downes%20EFRC%20Symp%2004%20Single.pdf.
[4] Duncombe, W., & Yinger, J. (2005). How much more does a disadvantaged student cost?. Economics of Education Review, 24(5), 513-532.
This blog post has been shared by permission from the author.
Readers wishing to comment on the content are encouraged to do so via the link to the original post.
Find the original post here:
The views expressed by the blogger are not necessarily those of NEPC.
