10th Period: Ohio Charter Schools' Shameful History of Bad Academic Performance
Nearly 1/2 of all failing Ohio Report Card grades handed out since 2005 have been given to Ohio Charter Schools, even though more than 3 times as many grades have been given to Ohio Public Schools
After about 30 years of looking at Ohio Charter Schools, I kind of use a shorthand when describing them — notoriously poor performing. And I assume everyone understands what that means.
However, I have come to realize that perhaps a portion of my readers may not be familiar with the Ohio Charter School Wars waged between 1999 and 2017. Since 2017, Ohio’s school choice warriors have focused primarily on exploding the amount of state taxpayer money being used to unconstitutionally subsidize wealthy parents’ private school tuitions.
But Ohio’s Charter Schools have continued receiving huge taxpayer investments — $1.56 billion this year alone, which dwarfs even Ohio’s $1 billion unconstitutional private school tuition subsidy. We now give more state money to Ohio Charter Schools than we give to all 8 of Ohio’s major urban school districts.
Yet Ohio’s Charter Schools aren’t getting all that money because they’re killing it academically. In fact, the state’s current report card reveals pretty much what it always has revealed — Ohio’s Charter Schools perform far worse than Ohio’s public school districts.
Charter advocates have always hated having their schools’ performance compared with Ohio Public School Districts. They have insisted that their schools’ performance should be compared solely with the performance of a handful of the most struggling public schools in Ohio’s urban core, despite the fact that Ohio Charter Schools take students from nearly every Ohio public school district — including Charter Schools in Ohio’s urban core.
For example, Breakthrough Charter Schools in Cleveland (which at one time was the best-performing Charter School chain in the state) take about 75% of their kids from Cleveland Municipal School District. The rest come from surrounding suburban districts.
Charter schools don’t get to cherry pick their students, take funding from all Ohio public school students, be considered a “district” for federal funding purposes, then have their performance compared with a handful of the most struggling urban school buildings.
Sorry.
If you take $1.56 billion from every public school kid and 126,000 students from nearly every Ohio public school district, your performance will be compared with every Ohio public school district.
You’re big boys now. Your students get more state funding than 97% of Ohio’s public school students. You’ve been around since 1998. You’re no longer the experiment; you’re the status quo. And, I’m sorry, but you guys are sucking something awful.
NOTE: If you don’t want to know my methodology, scroll down. This next part is for the nerds.
I want to explain a couple things about this performance analysis. There have been three different Ohio academic accountability systems since 2005 — the earliest readily available data on the Ohio Department of Education1’s website. However, they have generally been divided into 5 categories.
-
Between the 2005-2006 and 2012-2013 school years, we used the Excellent (Excellent with Distinction was added in 2007-2008), Effective, Continuous Improvement, Academic Watch and Academic Emergency.
-
Between 2012-2013 and 2021-2022, we used the A-F grading system.
-
Since 2021-2022 (during the 2019-2020 and 2020-2021 COVID years, we didn’t do the ratings), we’ve used the 5 stars system.
What I did was convert these various systems into a single A-F metric, with a couple caveats. When the state issued Excellent with Distinction designations, I counted that as an A+ and included those in overall A grades (so if you got 10 Excellent and 1 Excellent with Distinction grade that was 11 As for my analysis). Since the 2022-2023 school year, we’ve had .5 stars added to each category (so, 1 Star, 1.5 Stars, 2 Stars, 2.5 Stars, etc.). I combined all 1s into a single F grade — so all 1 Star and 1.5 Star grades count as an F in my conversion.
I also included District-level ratings, not the additional grades given to Ohio’s 3,300 or so Public School District buildings because Charters are considered districts for state and federal funding purposes and the funding Charters take from Public School students is taken from all Public School students in a district.
So the impact of Charter School funding isn’t restricted to the lowest-performing buildings in a Public School District (which is what Charter fans always want to suggest); it’s felt by students throughout the Public School District from those in the lowest and highest-performing buildings. District-level data effectively works as an average performance measure throughout the district. In other words, these results provide enough data points to give us an overall view of Public School District performance versus Charter School performance.
Again, the point is to have an apples-to-apples comparison for 20 years of academic performance data across three different evaluation systems. What I wanted to answer was a very straightforward question: What percentage of high and low grades were earned by Ohio’s Charter Schools and Ohio’s Public School Districts? So how each of those ratings were calculated at the time didn’t matter. What mattered is how each school sector rated under the regime.
End of nerd session.
Widest Angle Examination
Let’s start at the 50,000-foot view by answering this question: What percentage of As, Bs, Cs, Ds and Fs has each sector received since 2005 (again, the A+ is for the few years the state did Excellent with Distinction)?
The answer is stunning. Even though Public School Districts have received about 70,000 total grades since 2005 and Charter Schools have received about 21,000, Charter Schools have received nearly 1/2 of all F grades and Ohio’s Public School Districts have received 90% of all As and Bs (and all but 10 A+s!!). Let that sink in for a moment as you look over the chart below.
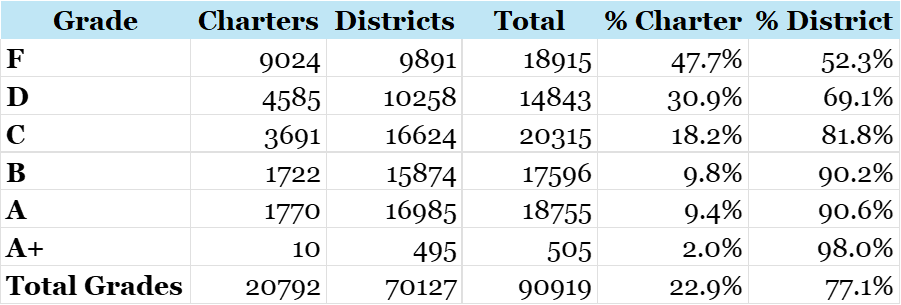
All Ohio State Report Card Grades received by education sector 2005-2006 to 2024-2025
Just stunning.
For shits and gigs, I ran the result on F grades through the Gemini AI engine to determine what the chances are of this result happening randomly. Here’s what Gemini told me (after showing its binomial distribution calculation):
“The probability of this result occurring by random chance is practically zero. It is statistically impossible for a random process to yield this outcome, indicating that the distribution of failing grades is driven by a specific non-random cause rather than coincidence.”
Ya think?
Trends Suck Too
Ok. Overall, Charter School performance has sucked. But maybe it’s gotten better, right? I mean they now receive more per pupil state funding than 97 percent of Ohio Public School students, so that must mean Ohio’s lawmakers and Governors are rewarding their improvement, right? I mean, why else would their funding double over 14 years and triple over 20 years with modest enrollment increases over the last dozen years or so2?
Well it ain’t because of academic improvement, I can tell you that.
Here’s Ohio Charter Schools’ percentage of Ds and Fs and As and Bs since 2005 in one graphic:
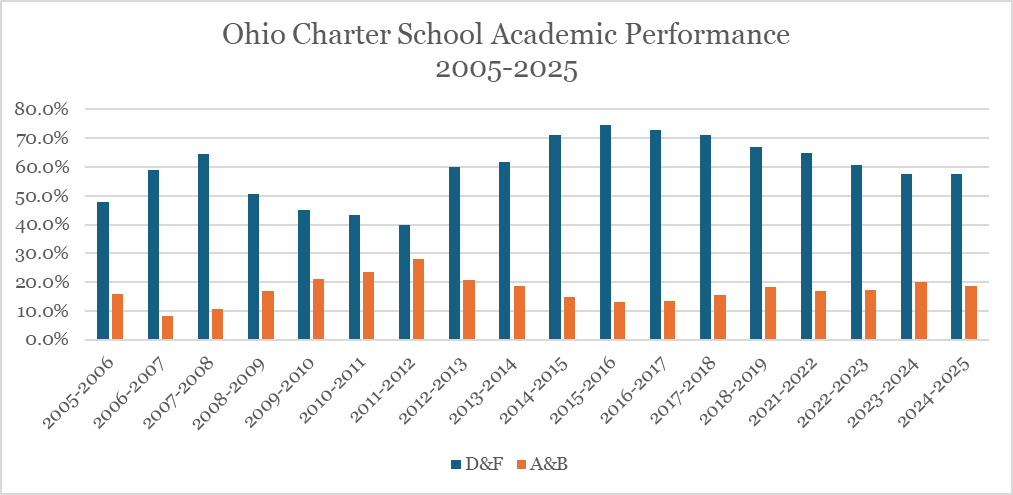
I mean, just abysmal.
-
There have been only 4 of the last 20 years when less than 50% of all Charter School grades were NOT Ds or Fs. — none of those years have been since 2012-2013.
-
Since the new Star system was adopted, Ohio Charter Schools still receive nearly 60% Ds or Fs.
-
On the opposite end, less than 20% of all Charter School grades are As or Bs. Only 3 times since 2005 have Charter Schools received more than 20% As or Bs.
-
Likewise, the changes in rating system have had little impact on overall ratings for Charter Schools. They generally receive about 60% Ds and Fs and about 18% As and Bs.
Dreadful.
Let’s look at Ohio’s Public School Districts, shall we?
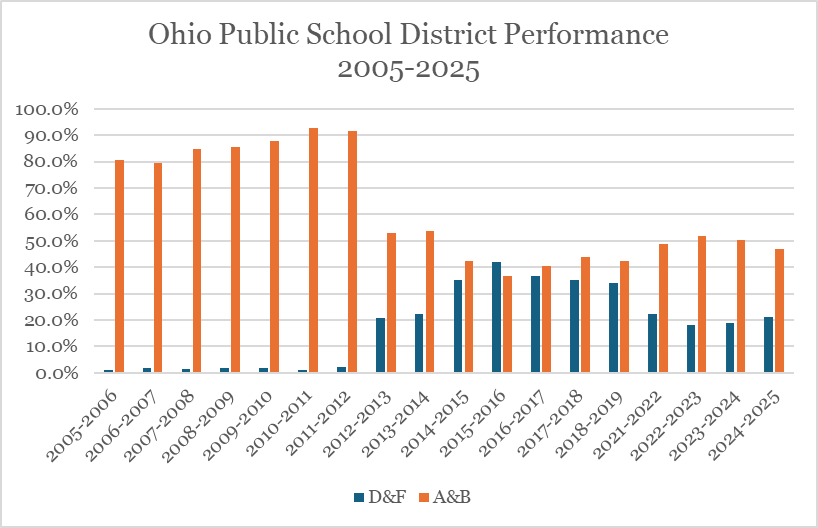 I mean, c’mon. If this was a fight, it would have been called years ago.
-
Under the first ratings system, Ohio’s Public Schools consistently received 80% As and Bs and fewer than a handful of Ds and Fs (much to Ohio Republican Lawmakers’ chagrin at the time — they always claimed the system was too “easy”, even though Charters failed so miserably under even this “easy” system).
-
Only once in the last 20 years have Ohio’s Public School Districts received more Ds and Fs than As and Bs — and that was the 2015-2016 school year when the state changed its testing regime to deliberately make passing those tests harder (remember the Common Core fight? Seems quaint these days.).
-
Under the new Star system, Ohio’s Public School Districts receive about 50% As and Bs and less than 20% Ds and Fs. Just about the exact opposite result of Ohio’s Charter Schools
No matter what Ohio lawmakers have done to try to make Ohio’s Public School Districts look bad, educators and kids have adjusted and thrived, overall. Meanwhile, Ohio’s Charter Schools have utterly failed to make that same adjustment.
Take the 2015-2016 school year — the year the state moved to a the more difficult testing regime tied to the controversial Common Core. While Ohio’s Public School Districts for the first and only time on record produced slightly more Ds and Fs than As and Bs, nearly 60% of Ohio’s Charter Schools’ grades that year were Fs.
Not Ds and Fs.
Straight up Fs.
Only 23% of Ohio’s Public School District grades were Fs that year.
And Ohio’s Public School Districts have adjusted well enough that today, only 4.7% of Ohio’s Public School District grades are Fs. Charters? More than 6 times that rate — 26.2%.
Ok. I guess that’s better than 60% Fs, but, I mean, c’mon man. That blows.
Even with that “improvement”, last year, Charters made up only 23% of all the Star grades issued last school year but accounted for 62.5% of all the Fs given.
Gemini had fun with that result.
“To put this in perspective, you are more likely to win the Mega Millions jackpot ten times in a row than to see this grade distribution happen by luck alone.”
Since the new report card system came out in 2021-2022, Ohio’s Charter Schools have received 1,397 1 Star or 1.5 Star ratings (Fs in my calculation). That’s more than double the 686 received by Ohio’s Public School Districts. Districts have received three times as many grades as Charters during this period.
Now you know why every time I talk about Ohio Charter Schools, I refer to them as notoriously poor performing.
One final thought: We’ve spent about $20 billion of your tax dollars funding these things since 1998.
How ya feeling about that?
1 I refuse to use the Department’s new name out of principle.
2 In 2005-2006, about 72,000 students attended Ohio’s Charter Schools. By the 2012-2013 school year Charters had about 120,000 students — roughly the same number they’ve had since (except for about 3 years after the infamous ECOT scandal removed those students from the count, even though they were probably never there to begin with, even though taxpayers was paying the school hundreds of millions of dollars to educate them).
This blog post has been shared by permission from the author.
Readers wishing to comment on the content are encouraged to do so via the link to the original post.
Find the original post here:
The views expressed by the blogger are not necessarily those of NEPC.