Janresseger: Research Shows State School District Report Cards Do Not Measure the Quality of Public Schools
The state of Ohio released 2023 public school district report cards last week. As usual, the press has reported that the state’s wealthy exurban school districts are the champions, and poor rural and urban districts are the losers. The Cleveland Plain Dealer‘s current data reporter, Zachary Smith, explains:
“A third of the school districts receiving top-level five-star scores in Ohio’s revamped school report card system are in Greater Cleveland, including a dozen districts in Cuyahoga County. Overall 25 of the 75 public districts statewide receiving five stars in the report cards released Thursday are from Cuyahoga and the surrounding counties—signifying that according to state guidelines, each ‘significantly exceeds state standards.’ While 12% of Ohio’s 607 districts received five stars, it was double that rate in Greater Cleveland and more than triple that rate in Cuyahoga County.”
You can see that, despite that this year the state stopped awarding A-F grades to the school districts and awarded up to five stars in each of a number of categories (with points adding up to an overall summative rating), the Cleveland Plain Dealer again reported the new school district report cards as a race with winners and losers. And as usual in the state school report card race, the rich are the winners and the poor are the losers.
The five categories this year that add up to an overall school district rating are: Achievement, Early Literacy, Graduation Rate, Progress, and Gap Closing. Except for the graduation rates, all the other categories are based on a comparison of the standardized test scores in each of the state’s school districts.
Experts will tell you that there is a long and comprehensive compendium of research demonstrating that standardized test scores DO NOT primarily reflect the quality of a district’s public schools. And more important, test scores do not present any picture of what is happening in anybody’s schools. They don’t tell us anything about how teachers work with students. Neither do they describe the schools’ strategies for school discipline; nor do they reflect the richness of the curriculum, the music and art program, the extracurricular offerings for enrichment, or whether students come to love learning.
Years of research instead clearly show that, when individual students’ standardized test scores are aggregated by school district, the rankings correlate with the family and neighborhood income of the community itself. A school district’s test scores are primarily a measure of privilege. Educators and sociologists have stopped using the term “achievement gaps”and have begun discussing the causes of “opportunity gaps.” We have known for years that No Child Left Behind’s focus on test score achievement gaps embodies an inaccurate understanding the factors that shape opportunity in children’s lives.
Here is just some of the research that has shifted the discussion to opportunity gaps in children’s lives. First there was Stanford University educational sociologist, Sean Reardon’s 2011 report on growing residential segregation by income—which correlates with segregation by race. Reardon used a massive data set to document the consequences of widening economic inequality for children’s outcomes at school. Reardon showed that while in 1970, only 15 percent of families lived in neighborhoods classified as affluent or poor, by 2007, 31 percent of families lived in such neighborhoods. By 2007, fewer families across America lived in mixed income communities. Reardon also demonstrated that along with growing residential inequality and residential segregation by income is a simultaneous jump in an income-inequality school test score gap. The gap between the children with income in the top ten percent and the children with income in the bottom ten percent, was 30-40 percent wider among children born in 2001 than those born in 1975, and twice as large as the black-white test score gap.
Then in 2016, Reardon documented: “The socioeconomic profile of a district is a powerful predictor of the average test score performance of students in that district.” “The most and least socioeconomically advantaged districts have average performance levels more than four grade levels apart. Average test scores of black students are, on average, roughly two grade levels lower than those of white students in the same district; the Hispanic-white difference is roughly one-and-a-half grade levels. Achievement gaps are larger in districts where black and Hispanic students attend higher poverty schools than their white peers… and where large racial/ethnic gaps exist in parents’ educational attainment. The size of the gaps has little or no association with average class size, a district’s per capita student spending or charter school enrollment.”
In 2022, Reardon commented on the factors that contribute to opportunity gaps: “We examine… test score gaps because they reflect… differences in access to educational opportunities. By ‘educational opportunities,’ we mean all experiences in a child’s life, from birth onward, that provide opportunities for her to learn, including experiences in children’s homes, child care settings, neighborhoods, peer groups, and their schools. This implies that test score gaps may result from unequal opportunities either in or out of school; they are not necessarily the result of differences in school quality, resources, or experience. Moreover, in saying that test score gaps reflect differences in opportunities, we also mean that they are not the result of innate group differences in cognitive skills or other genetic endowments… (D)ifferences in average scores should be understood as reflecting opportunity gaps….”
There are many other studies. Here are just some examples.
In 2017, Katherine Michelmore of Syracuse University and Susan Dynarski of the University of Michigan studied data from Michigan to identify the role of economic disadvantage in achievement gaps as measured by test scores: “We use administrative data from Michigan to develop a… detailed measure of economic disadvantage… Children who spend all of their school years eligible for subsidized meals have the lowest scores, whereas those who are never eligible have the highest. In eighth grade, the score gap between these two groups is nearly a standard deviation.” “Sixty percent of Michigan’s eighth graders were eligible for subsidized lunch at least once during their time in public schools. But just a quarter of these children (14% of all eighth graders) were economically disadvantaged in every year between kindergarten and eighth grade… Ninety percent of the test score gap we observe in eighth grade between the persistently disadvantaged and the never disadvantaged is present by third grade.
In 2017, Harvard University professor Daniel Koretz published The Testing Charade: Pretending to Make Schools Better, an authoritative book about the danger of depending on standardized testing to try to drive school improvement: “(E)ducation has many other goals beyond achievement in a few tested subjects. But even if one looks only at achievement in those subjects, tests are not fully representative of the domains they are intended to represent… The bottom line: the information yielded by tests, while very useful, is never by itself adequate for evaluating programs, schools, or educators.” (The Testing Charade, pp. 14-17. emphasis in the original) Koretz continues: “One aspect of the great inequity of the American educational system is that disadvantaged kids tend to be clustered in the same schools. The causes are complex, but the result is simple: some schools have far lower average scores…. Therefore, if one requires that all students must hit the proficient target by a certain date, these low-scoring schools will face far more demanding targets for gains than other schools do. Ty.” ( The Testing Charade, p. 129)
In September of 2022, Jack Schneider, a professor at the University of Massachusetts, Lowell and Joel Boyd, the superintendent of the Lowell Public Schools, wrote an article for Commonwealth Magazine explaining that the correlation of standardized test scores with family income has been an issue in Massachusetts as it has in other states through the past two decades since No Child Left Behind thrust us into school accountability based on standardized test scores: “As research indicates, test scores are highly indicative of the inequalities that afflict our communities, and are not a valid basis for determinations about overall school performance… Scholars have repeatedly shown (that) the leading predictors of student standardized test scores are demographic variables like family income and parental educational attainment.”
That same month, The Washington Post‘s Valerie Strauss published a piece written by two Northwestern University researchers, both sociologists, who have been evaluating our society’s obsession with ranking and rating. They describe their concerns about how the race for higher test scores in state school rankings undermines schools by shaping a narrow, test-driven curriculum that too often undermines students’ emotional well-being. Simone Ispa-Landa and Wendy Espeland declare: “We are a nation obsessed with lists and rankings, not just for dishwashers and other consumer products. We track our steps, rate our sleep, and go to hospitals with the ‘best ratings.’… In our research, we find that, across institutions, school leaders are pressured to devote enormous time and energy to ‘improving the numbers,’ even when this comes at the expense of making changes that, in private, they acknowledge would be far more impactful for students. Because rankings and other measures change how school leaders do their work and make decisions, current accountability policies have far-reaching implications for school discipline and student mental health at a moment of intense national crisis in child and youth well-being… We should acknowledge that one-size-fits-all metrics do not fairly measure what matters most in many schools…. We should reward schools for innovation, for creating programs that will take time to evaluate. Simple numbers promote simple solutions and can prevent promising programs with long-term positive implications from taking root.”
In Ohio Douglas Downey, a professor of sociology at The Ohio State University describes academic research showing that evaluating public schools based on standardized test scores is unfair to educators and misleading to the public. In a 2019 book, How Schools Really Matter: Why Our Assumption about Schools and Inequality Is Mostly Wrong, Downey explains: “It turns out that gaps in skills between advantaged and disadvantaged children are largely formed prior to kindergarten entry and then do not grow appreciably when children are in school.” (How Schools Really Matter, p. 9) “Much of the ‘action’ of inequality therefore occurs very early in life… In addition to the fact that achievement gaps are primarily formed in early childhood, there is another reason to believe that schools are not as responsible for inequality as many think. It turns out that when children are in school during the nine-month academic year, achievement gaps are rather stable. Indeed, sometimes we even observe that socioeconomic gaps grow more slowly during school periods than during summers.” (How Schools Really Matter, p. 28)
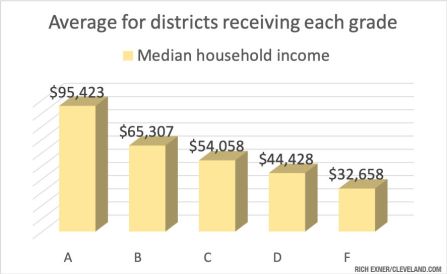
Finally, there is the simple correlation data published in 2019 by the Cleveland Plain Dealer‘s previous data wonk, Rich Exner. Exner examined the almost perfect correlation of the 2019 Ohio school district report cards with the school districts’ median household income. Exner’s is not academic, peer-reviewed research, but his graphs nonetheless expose the injustice of claiming—as our state continues to do in the 2023 state report card race—that Beachwood’s public schools are excellent and East Cleveland’s are failing. Beachwood is one of Ohio’s wealthiest Cleveland suburbs, and East Cleveland is another Cleveland suburb, one of the very poorest communities in the United States.
Over the years, the massive attention to the annual school district report card ratings in Ohio has constituted a form of educational redlining that has accelerated economic and racial segregation by encouraging wealthy white flight to the top ranked suburbs.
This blog post has been shared by permission from the author.
Readers wishing to comment on the content are encouraged to do so via the link to the original post.
Find the original post here:
The views expressed by the blogger are not necessarily those of NEPC.